The COVID-19 epidemic modeling team at ICM UW in August 2020 developed several scenarios showing the possible situations after the schools opened on September 1, 2020. The predictive task in this case was burdened with great uncertainty, due to the unknown virus transmissibility among people from school age groups – there is no clear epidemiological data on this subject. Therefore, it was decided to assume three levels of virus transmission among children and schoolchildren (10%, 30% and 50%) in order to check the effectiveness of selected administrative restrictions against each of them. Transmission rate refers to the likelihood of an adult infection without the use of preventive measures (e.g. face masks or social distancing)*. The probability of adults being infected has been calibrated against data from earlier stages of the epidemic when schools were closed.
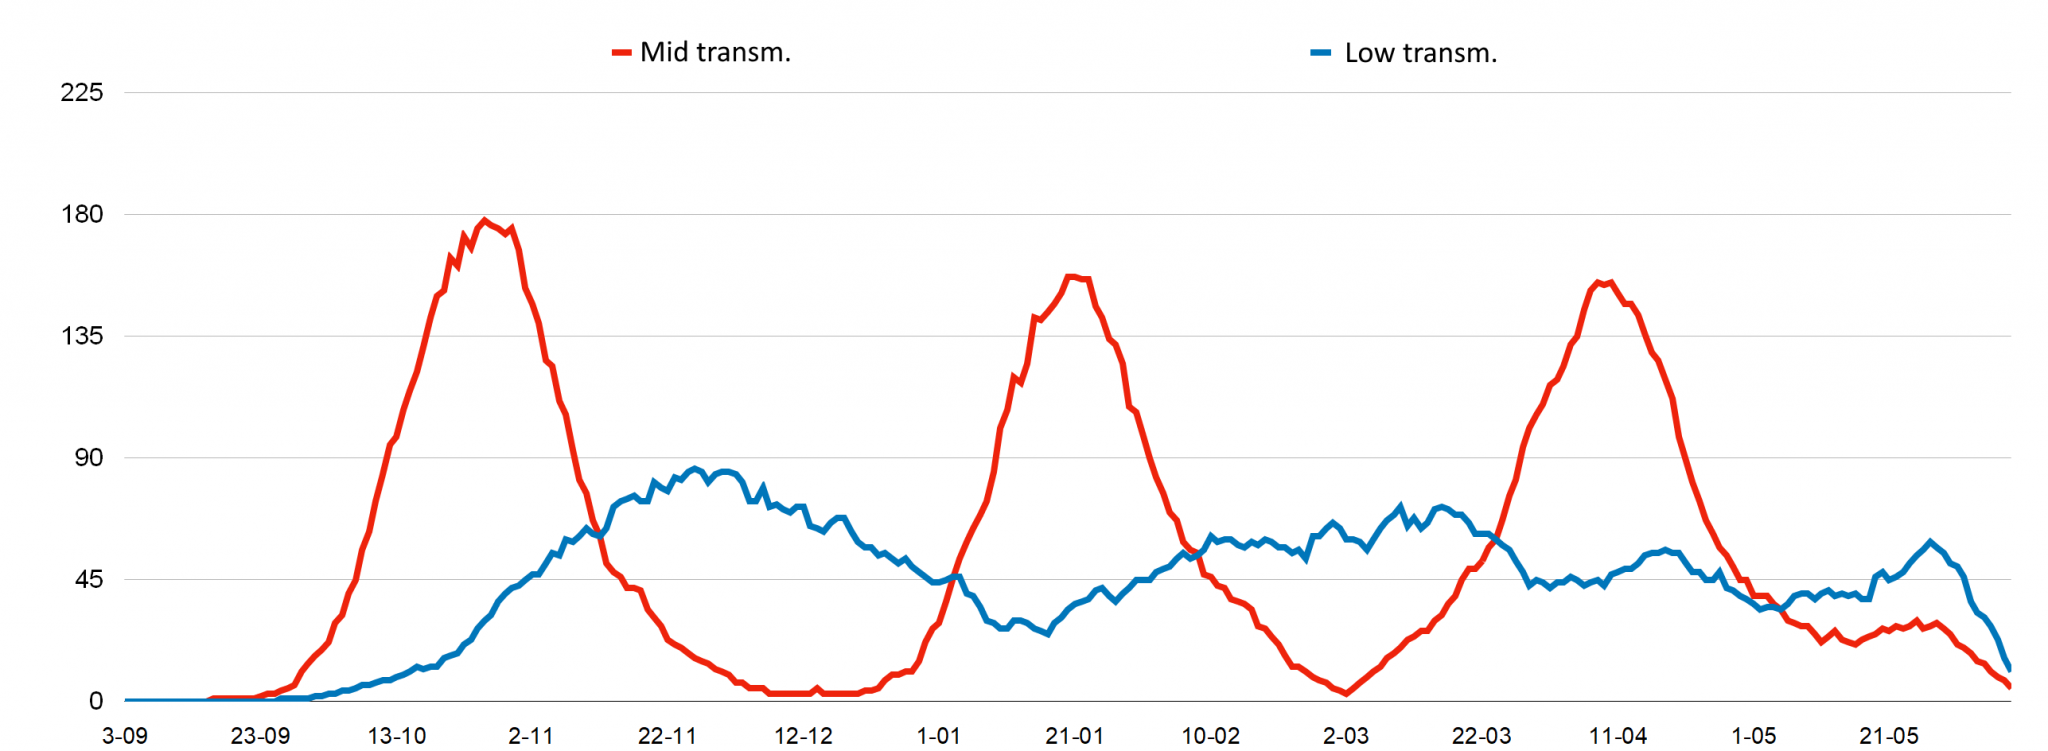
Below we present two runs of the number of new detected cases, for the transmission capacity of 30% and 50%. The transmissivity of 10% does not cause significant increases in the number of cases compared to the numbers recorded in August (the epidemic remains in the so-called subcritical regime). In this simulation, all kindergartens remain closed, and transmissivity in other contexts, such as households, street contacts, and workplaces, remains at the August level. As you can see, the “50%” prediction leads to a large number of new cases and peaks in mid-December. It should be noted, however, that such predictions with a high epidemic peak are unlikely to come true – before it climaxes, society will slow down or stop the increase in infections by itself or through formal restrictions.
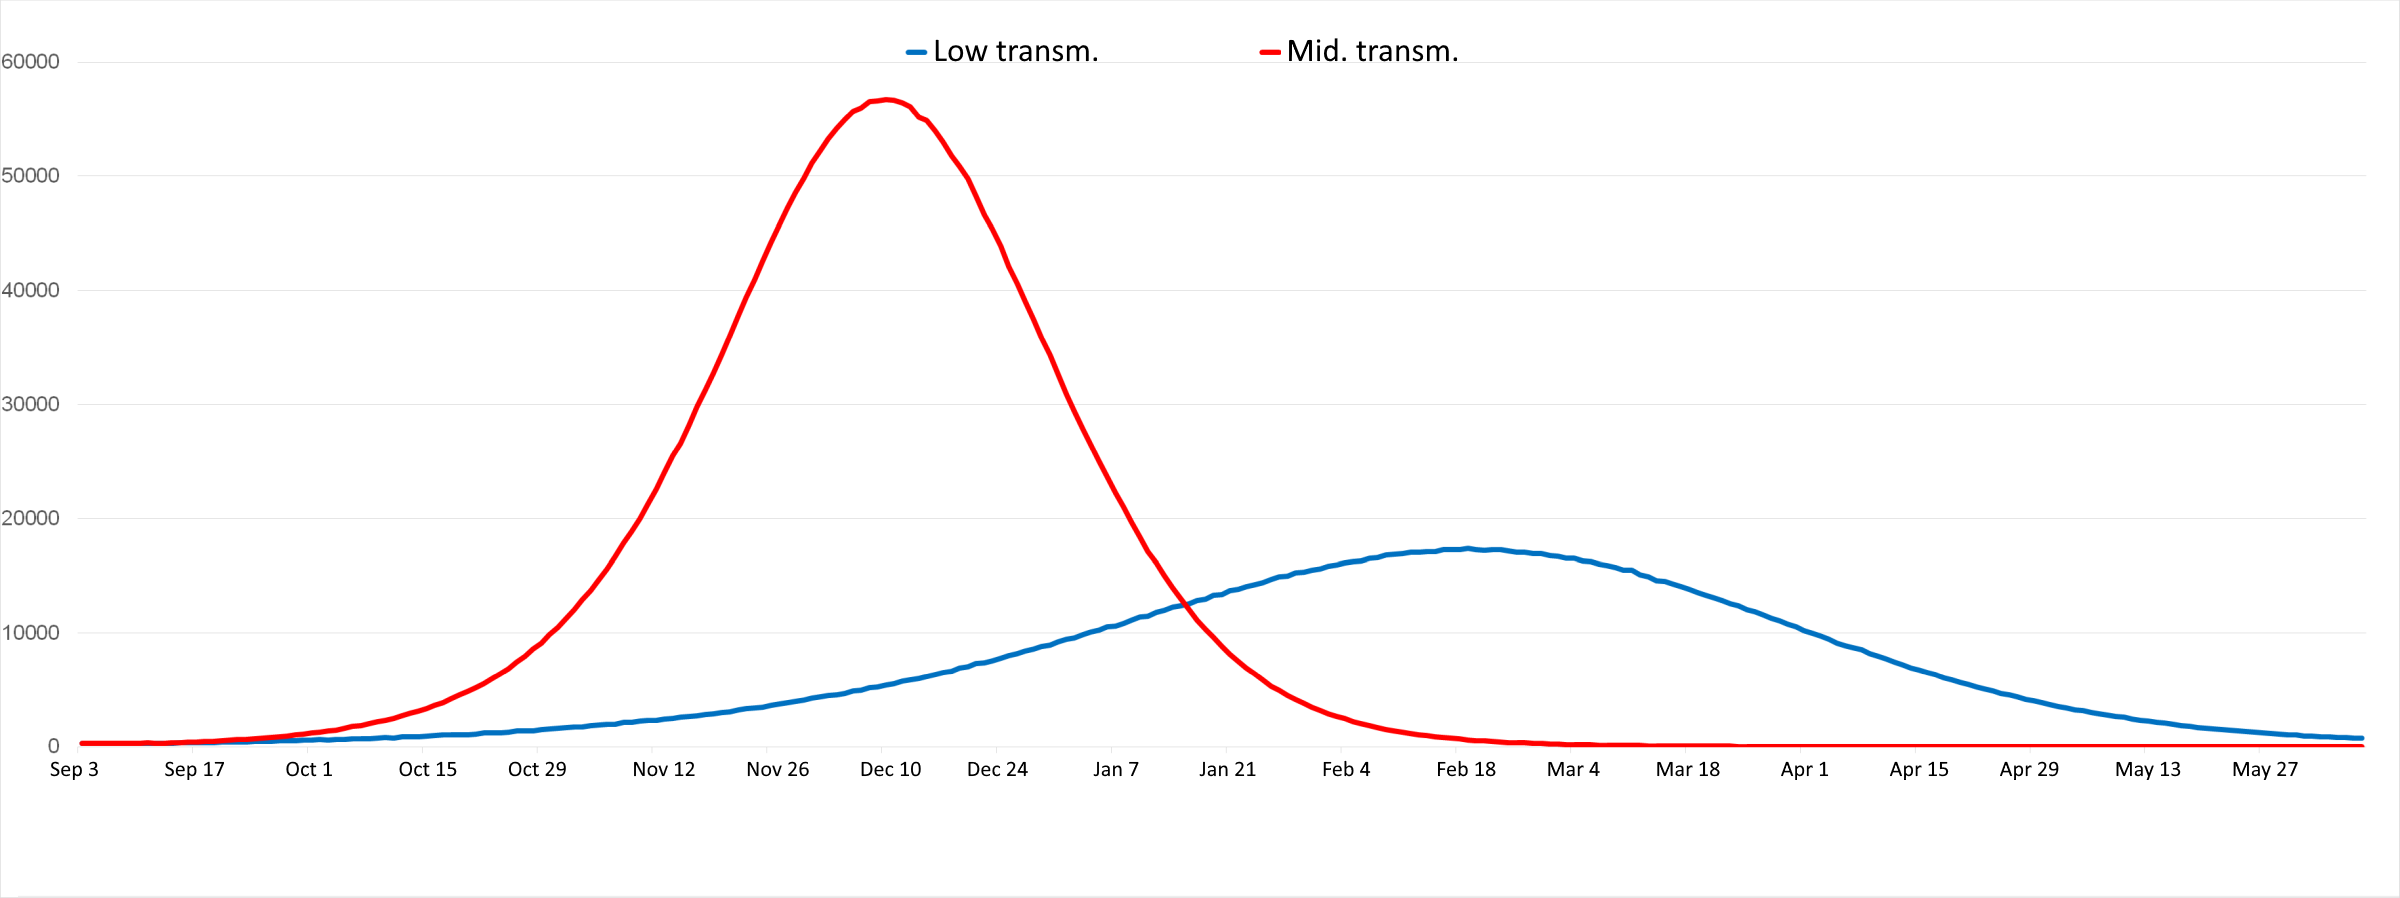
Fig. 1. Number of identified cases depending on the transmissivity – cases of free waveforms.
Download the chart in full resolution
Simulation of regional and dynamic restrictions (school lockdown):
Taking the simulations with the assumptions presented above as a starting point, simulations of the following restrictive procedures were carried out: if 6 new cases per 10,000 residents are registered in a given powiat during a two-week period – schools in this powiat are closed for 2 weeks. Schools are opened after 2 weeks and if the number of new infections is below 4 per 10,000 inhabitants over a two-week period. As can be seen from the simulation, such a restriction mechanism makes it possible to stop the pace of the increase in the number of new cases, even with high transmissibility in schools, while minimizing the total time of closing educational institutions. The number of powiats with periodically closed schools varies over time and also depends on the transmission of the virus (Fig. 3).
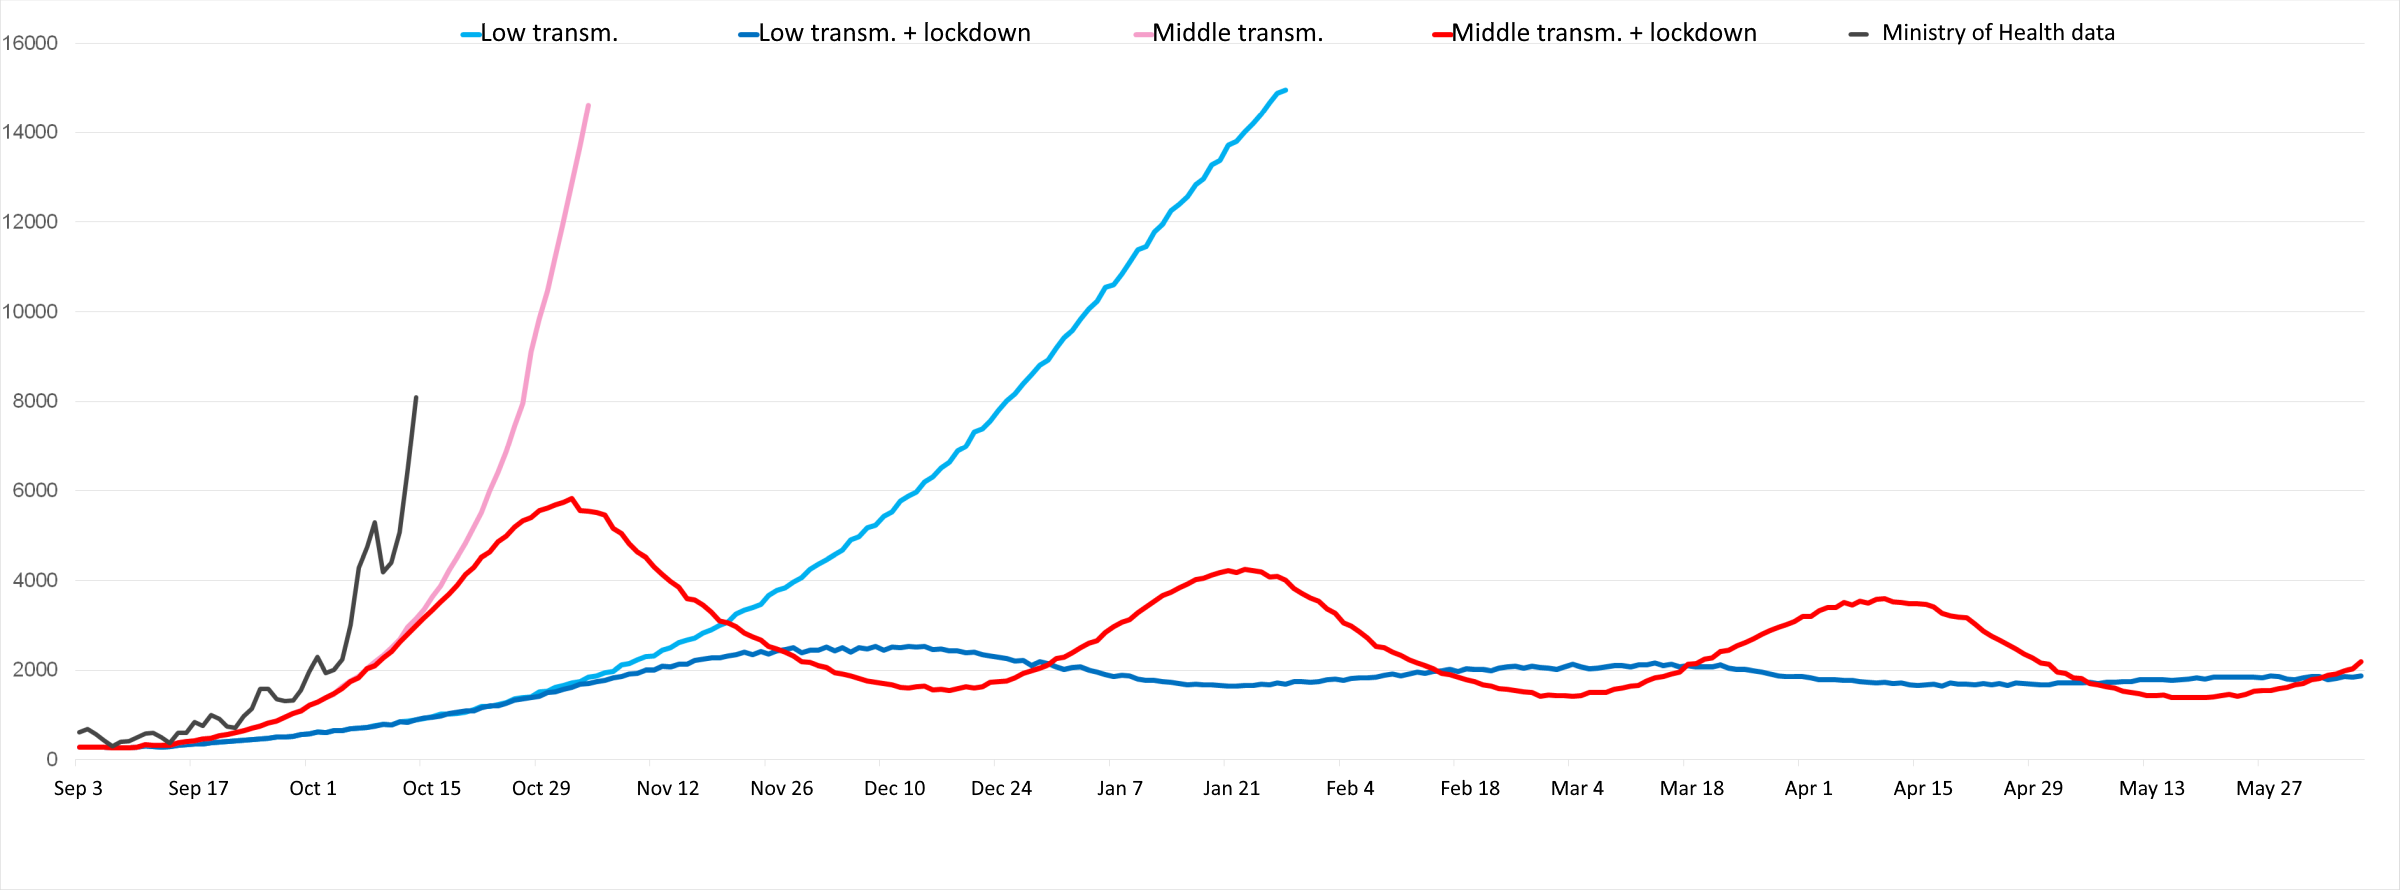
Fig. 2. Scenarios of freely running epidemics and with dynamic regional restrictions (lockdown of schools). To highlight the impact of dynamic school closings and openings on the number of new cases, we present a chart where data on new cases has been truncated above 15,000 cases / day.
Download the chart in full resolution
These analyzes show the simulation runs for two values of the parameter describing the transmissivity in schools. This parameter is currently difficult to estimate. Even if there is an obvious correlation in time between the opening of schools and an increase in the pace of accrual, the strength of the direct influence of transmissivity in students is not directly determinable by the available data. Undoubtedly, the opening of schools has also triggered many accompanying social processes such as commuting to schools, extracurricular activities, school social gatherings, and it is currently difficult to estimate what the real proportion between these factors is. In our model, all these effects have been grouped into a single quantity describing the transmissibility of the virus in schools. In our forecasts, we also examined the development of the epidemic for the assumed 10% of transmission among students – it did not, however, cause significant increases in infections. The transmission probability values that appear in the analysis of 10%, 30%, 50% are obviously not the same as the number of cases found in a school context, where applicable.
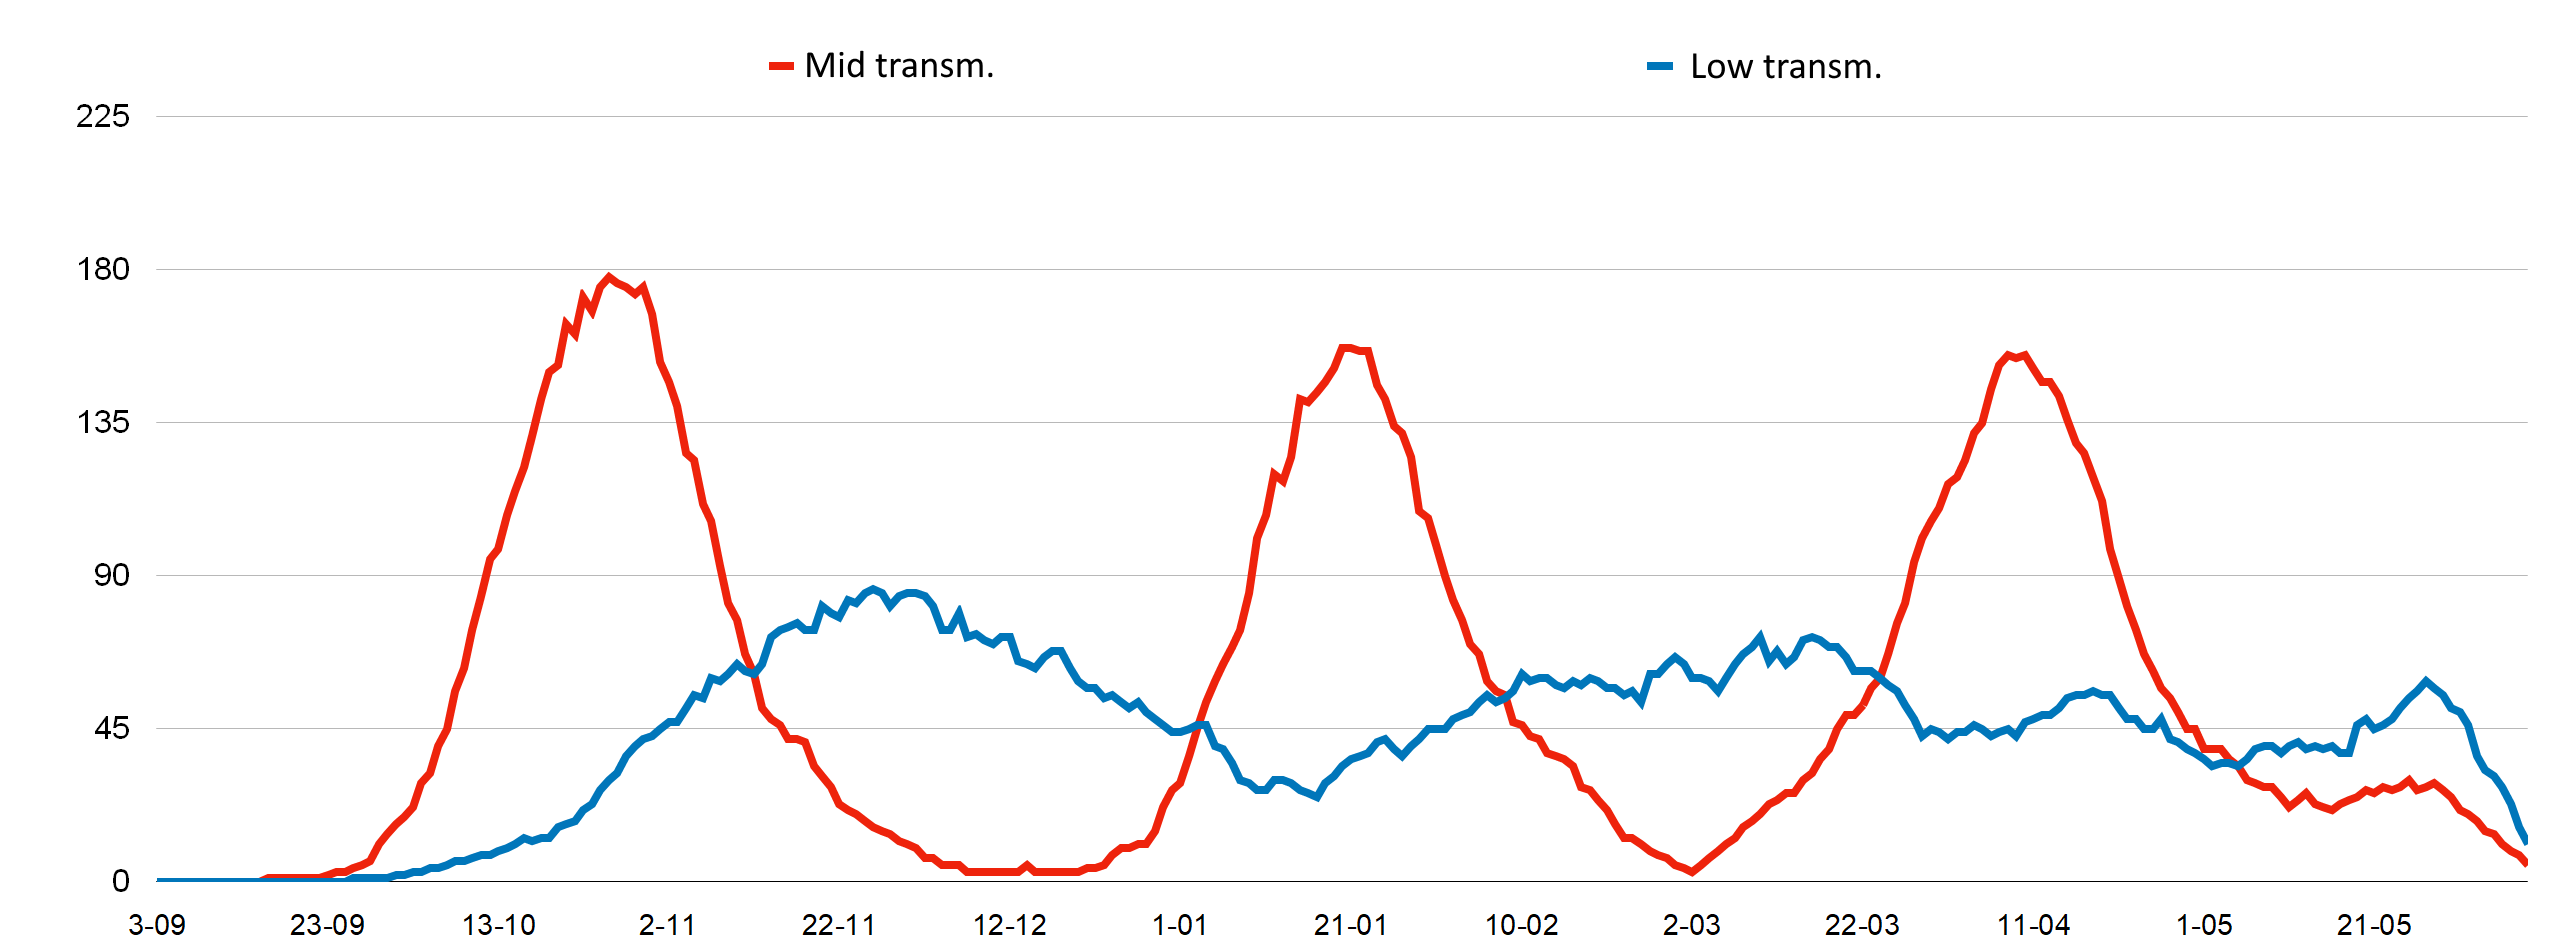
Fig. 3. Number of powiats closed during dynamic restrictions.
Download the chart in full resolution
* The detailed impact of the weights of individual contagion contexts is described in our article Rakowski, F.; Gruziel, M.; Bieniasz-Krzywiec, L. & Radomski, JP Influenza epidemic simulation spread for Poland – a large scale, individual-based model study, Physica A , 2010, 389 (16) pp 3149_3165. For example, if the transmissivity in the current context is 33% relative to the reference context, it means that for the probability of infection to be the same as in the reference context, the exposure time to the virus in the current context must be three times greater than in the reference context.