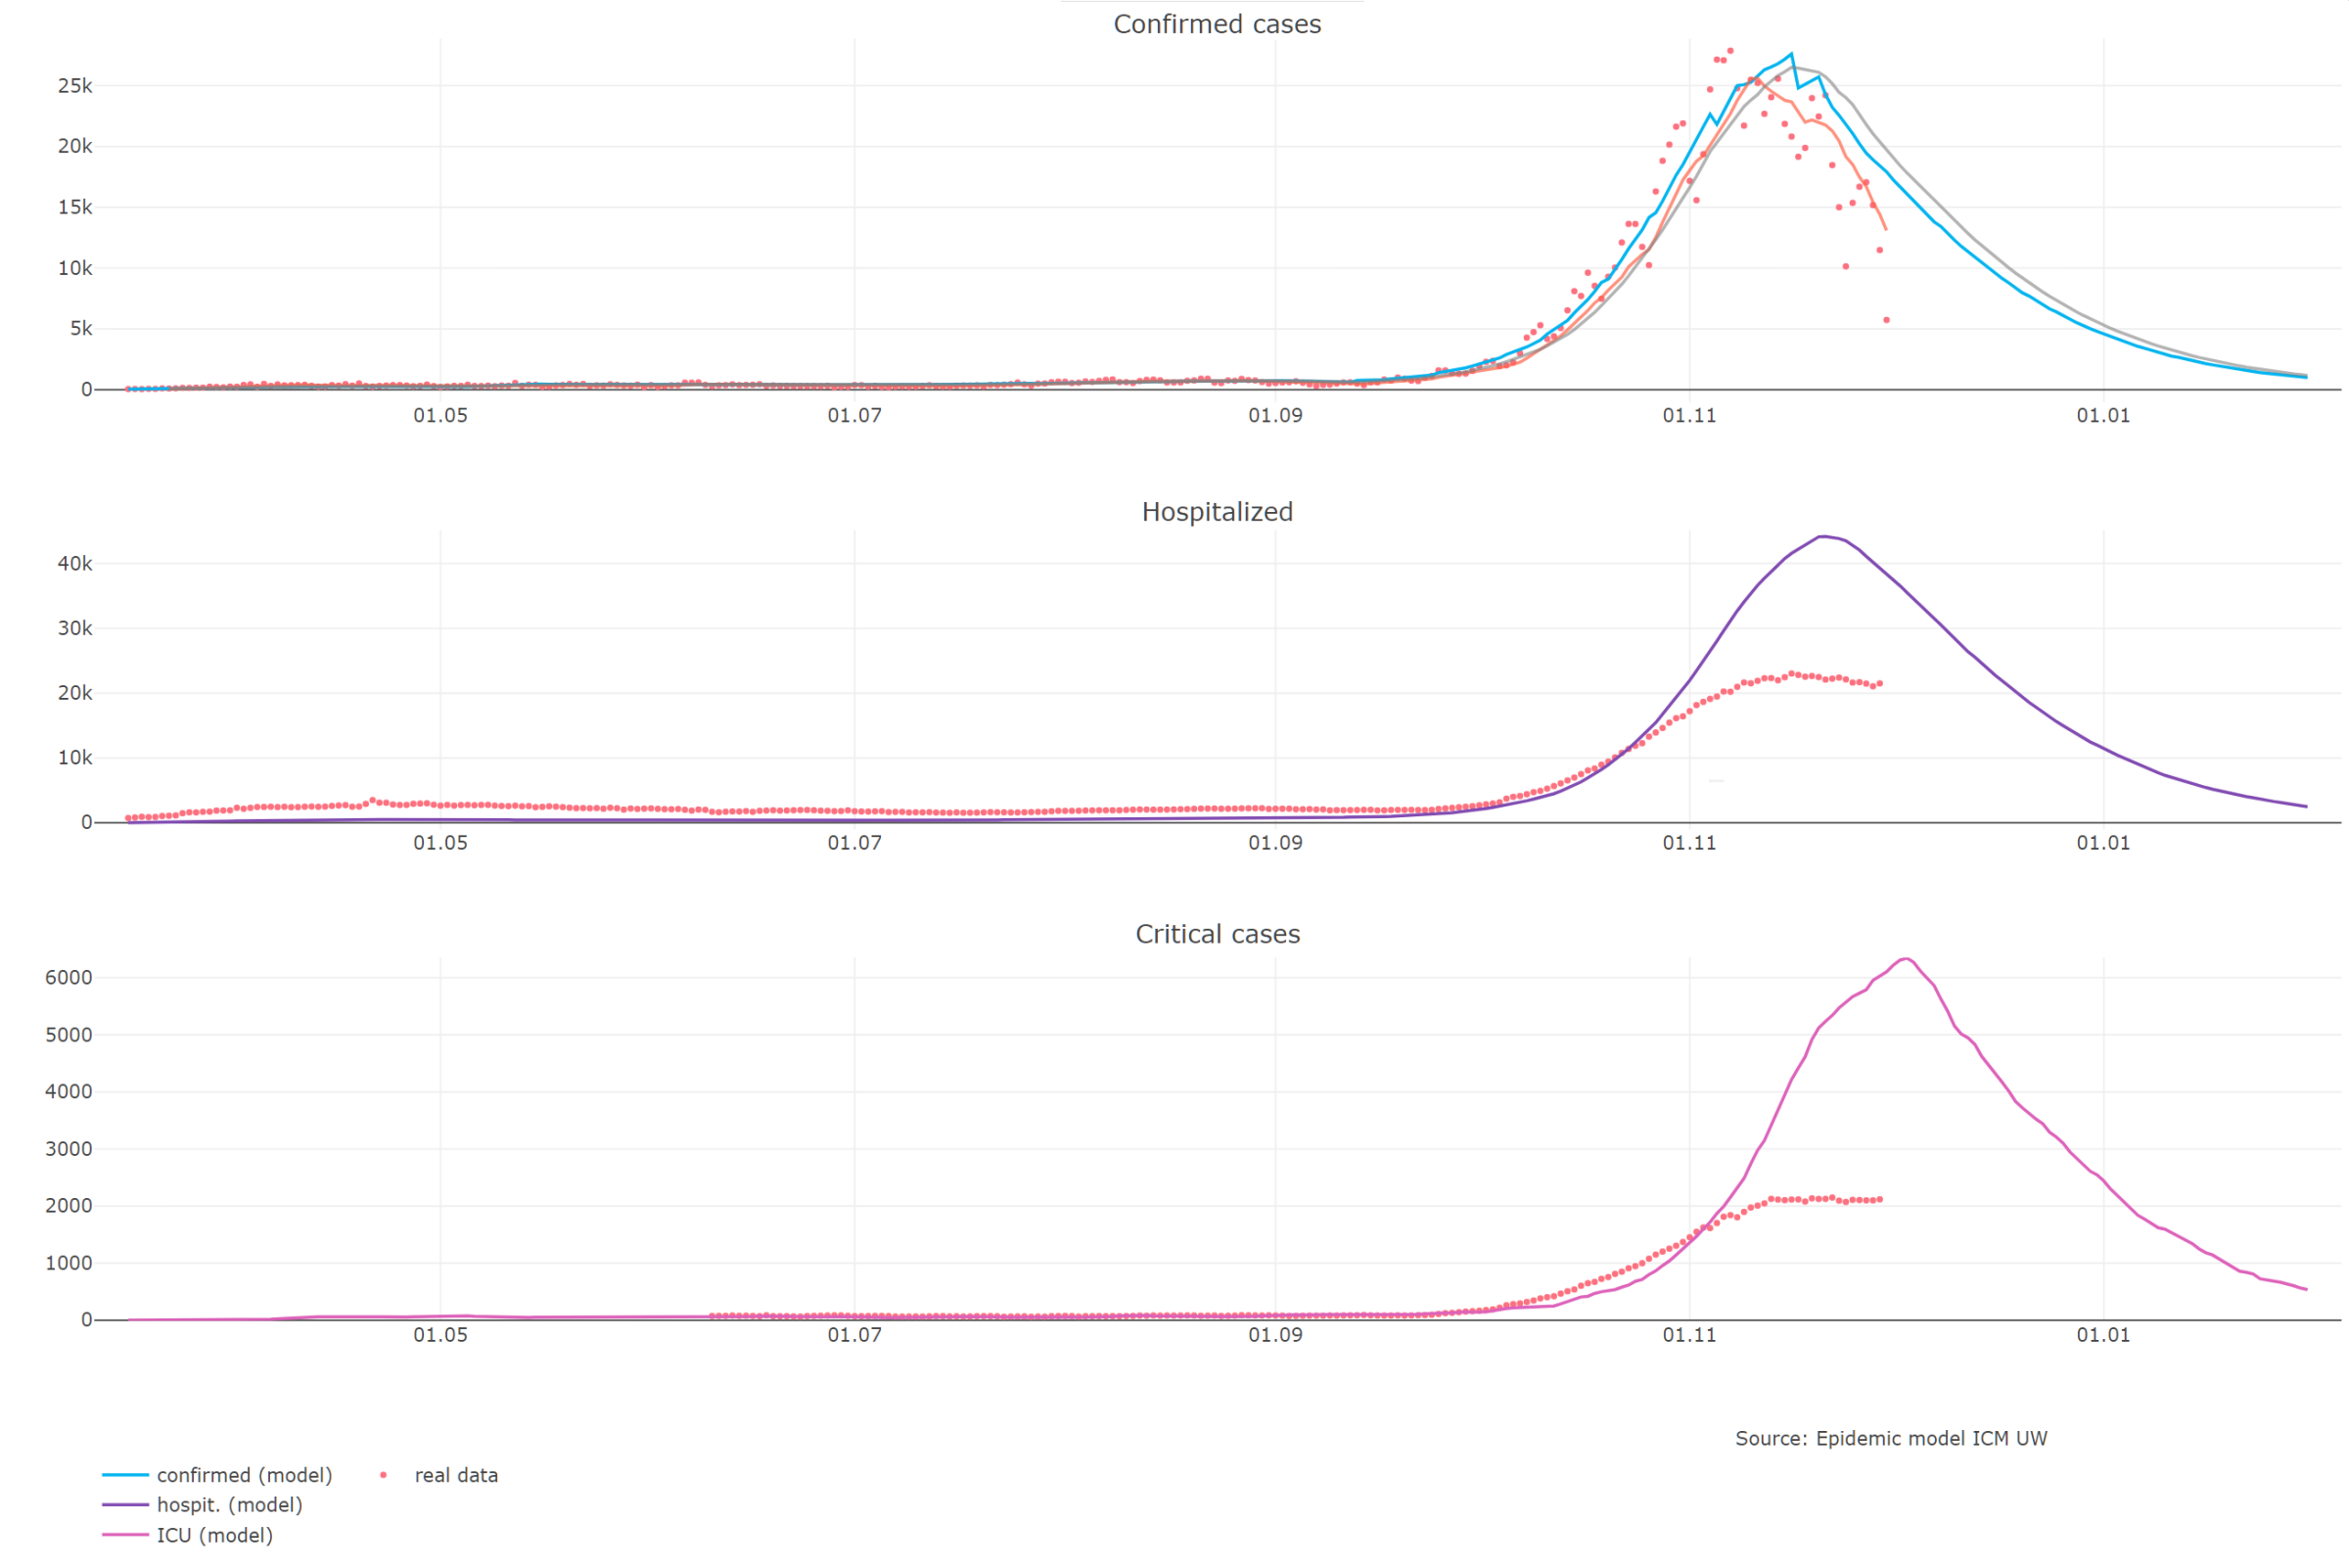
Current forecasts
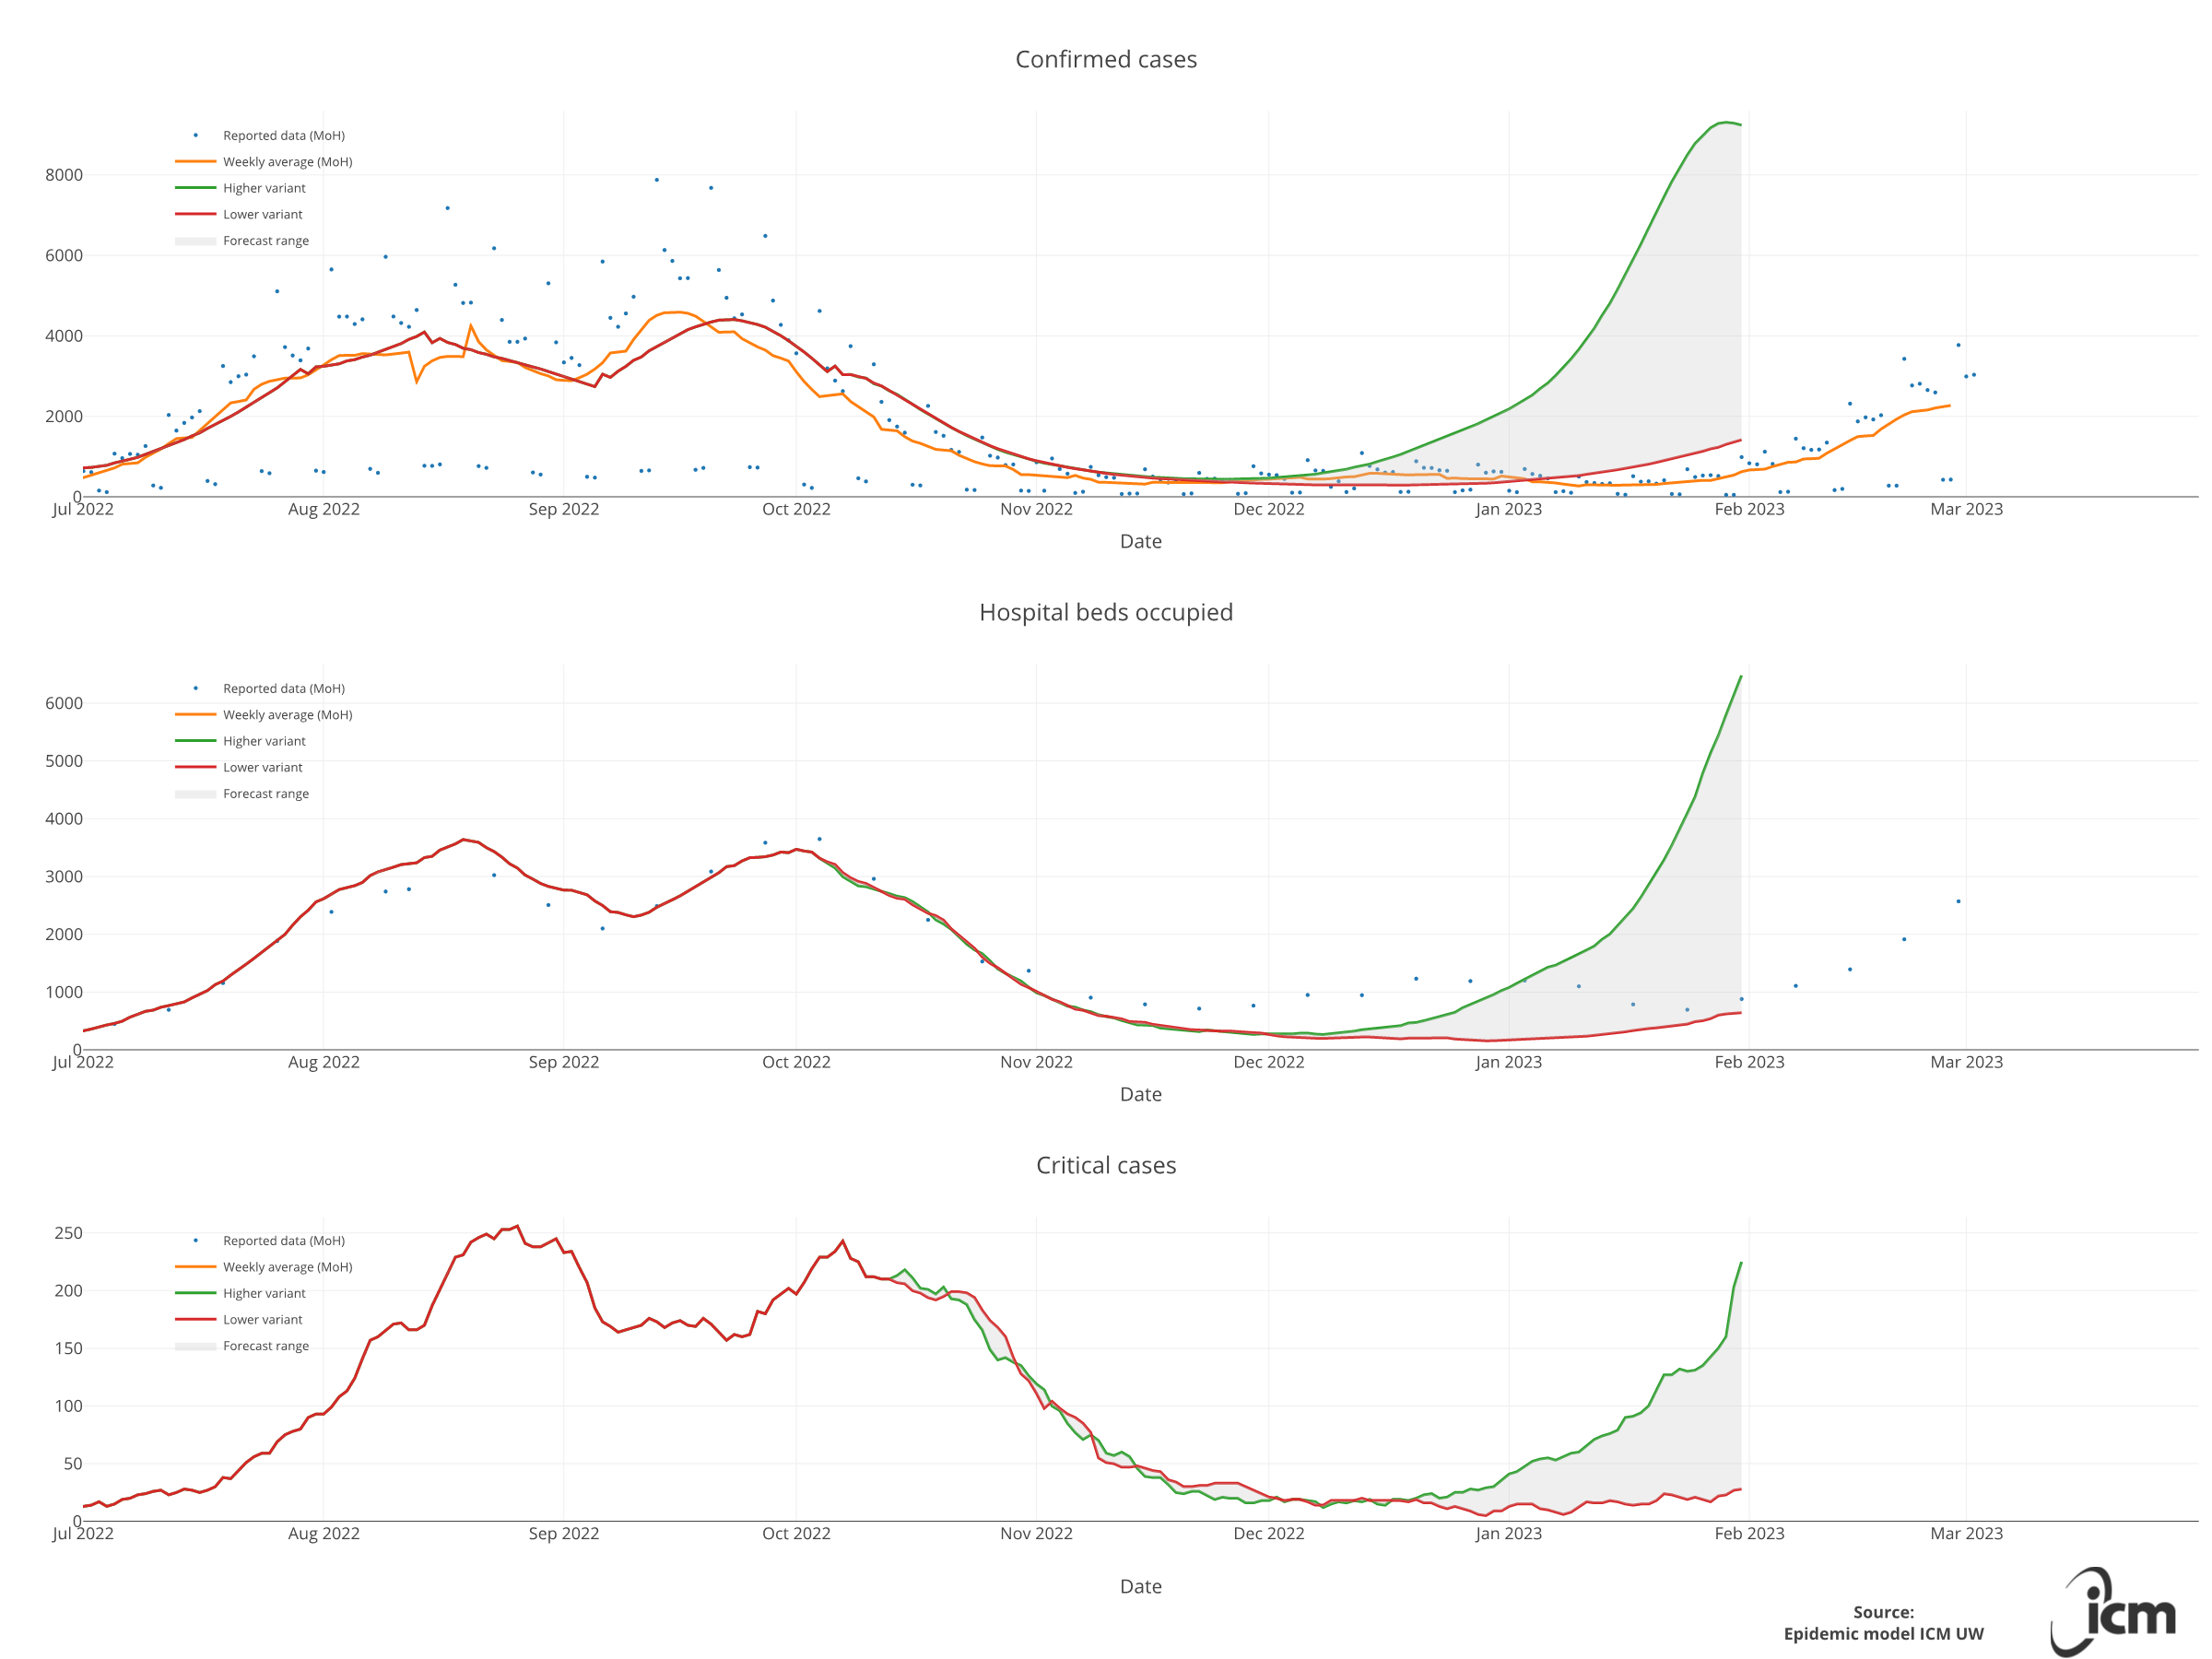
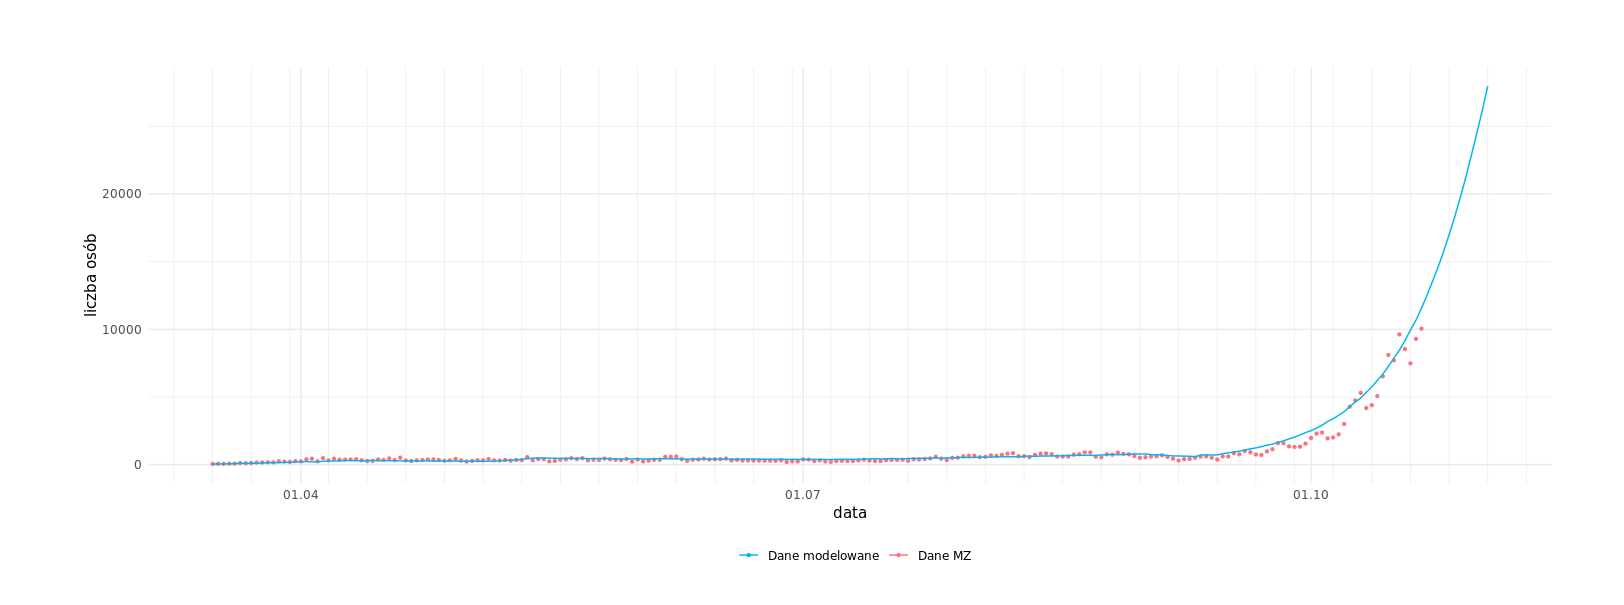
Dynamic chart of identified cases of Covid-19 infection in the period beginning March 16, 2020 with a prediction to June 30, 2023.
Chart prepared on the basis of the forecast of March 3, 2023.
The current forecast takes into account all historically introduced restrictions and relaxations, partly the increase in mobility and contact related to the influx of refugees, the seasonality effect, the impact of holidays, declining immunity and the beginning of the school and academic year. The forecast takes into account the sub-variant BA2 of the omicron variant, the sub-options BA4/BA5 and the sub-options BQ.1/BQ.1.1 and XBB.1.5 in two options: optimistic and pessimistic cross-resistance scenarios with the previous variants.
Numbers of identified cases (data reported by the Ministry of Health) from February 8, 2022 are given together with reinfections. The daily number of hospitalizations is not reported from April 1, 2022, from April 12, it is reported every week. Numbers of occupied ICU beds are not reported from April 1, 2022, therefore, the plots of occupied ICU beds are uncalibrated.
You can read more about the considered variants and the impact of the assumptions on the forecast in the Analysis and Scenarios tab.
We also publish our results on the portal https://covid19forecasthub.eu/visualisation.html. This platform provides forecasts for most European countries from a number of Covid-19 modeling teams.
The graph is displayed by default from July 1st. Double-clicking returns to the graph view for the entire pandemic period.
The data from the Ministry of Health is taken from the Report on coronavirus infections (Sars-CoV-2), published at: https://www.gov.pl/web/koronawirus/wykaz-zarazen-koronawirusem-sars-cov-2
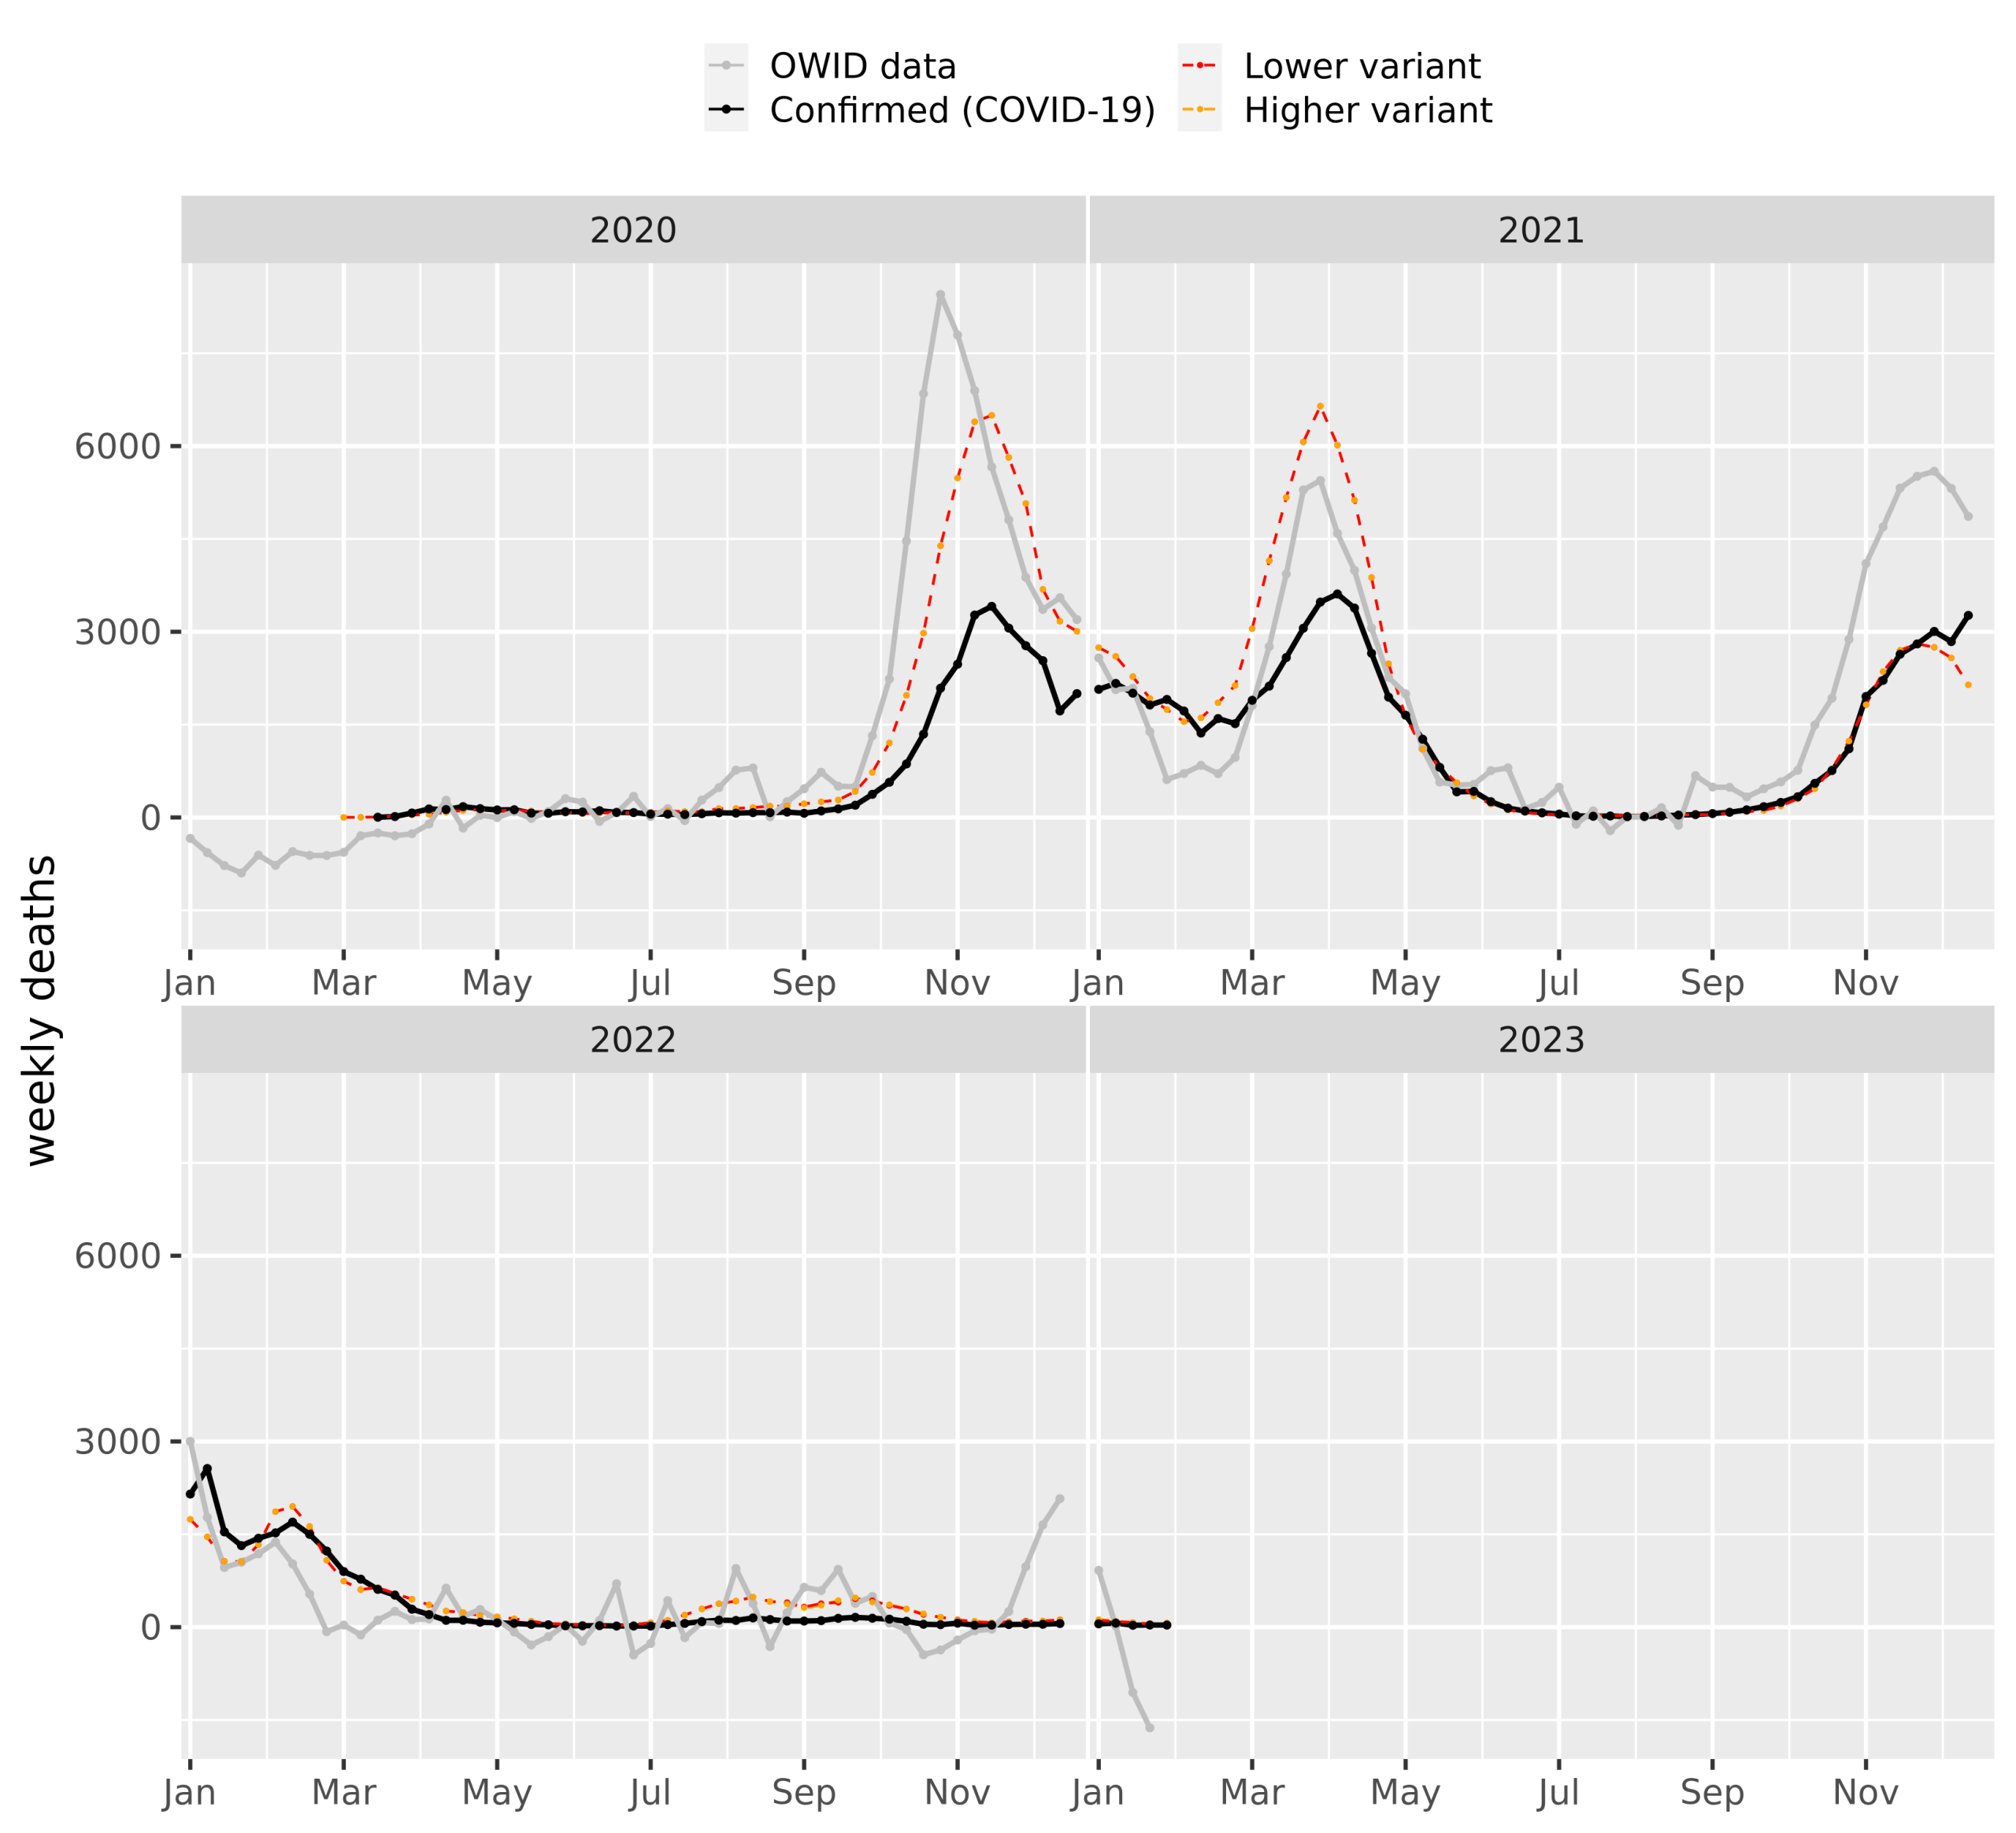
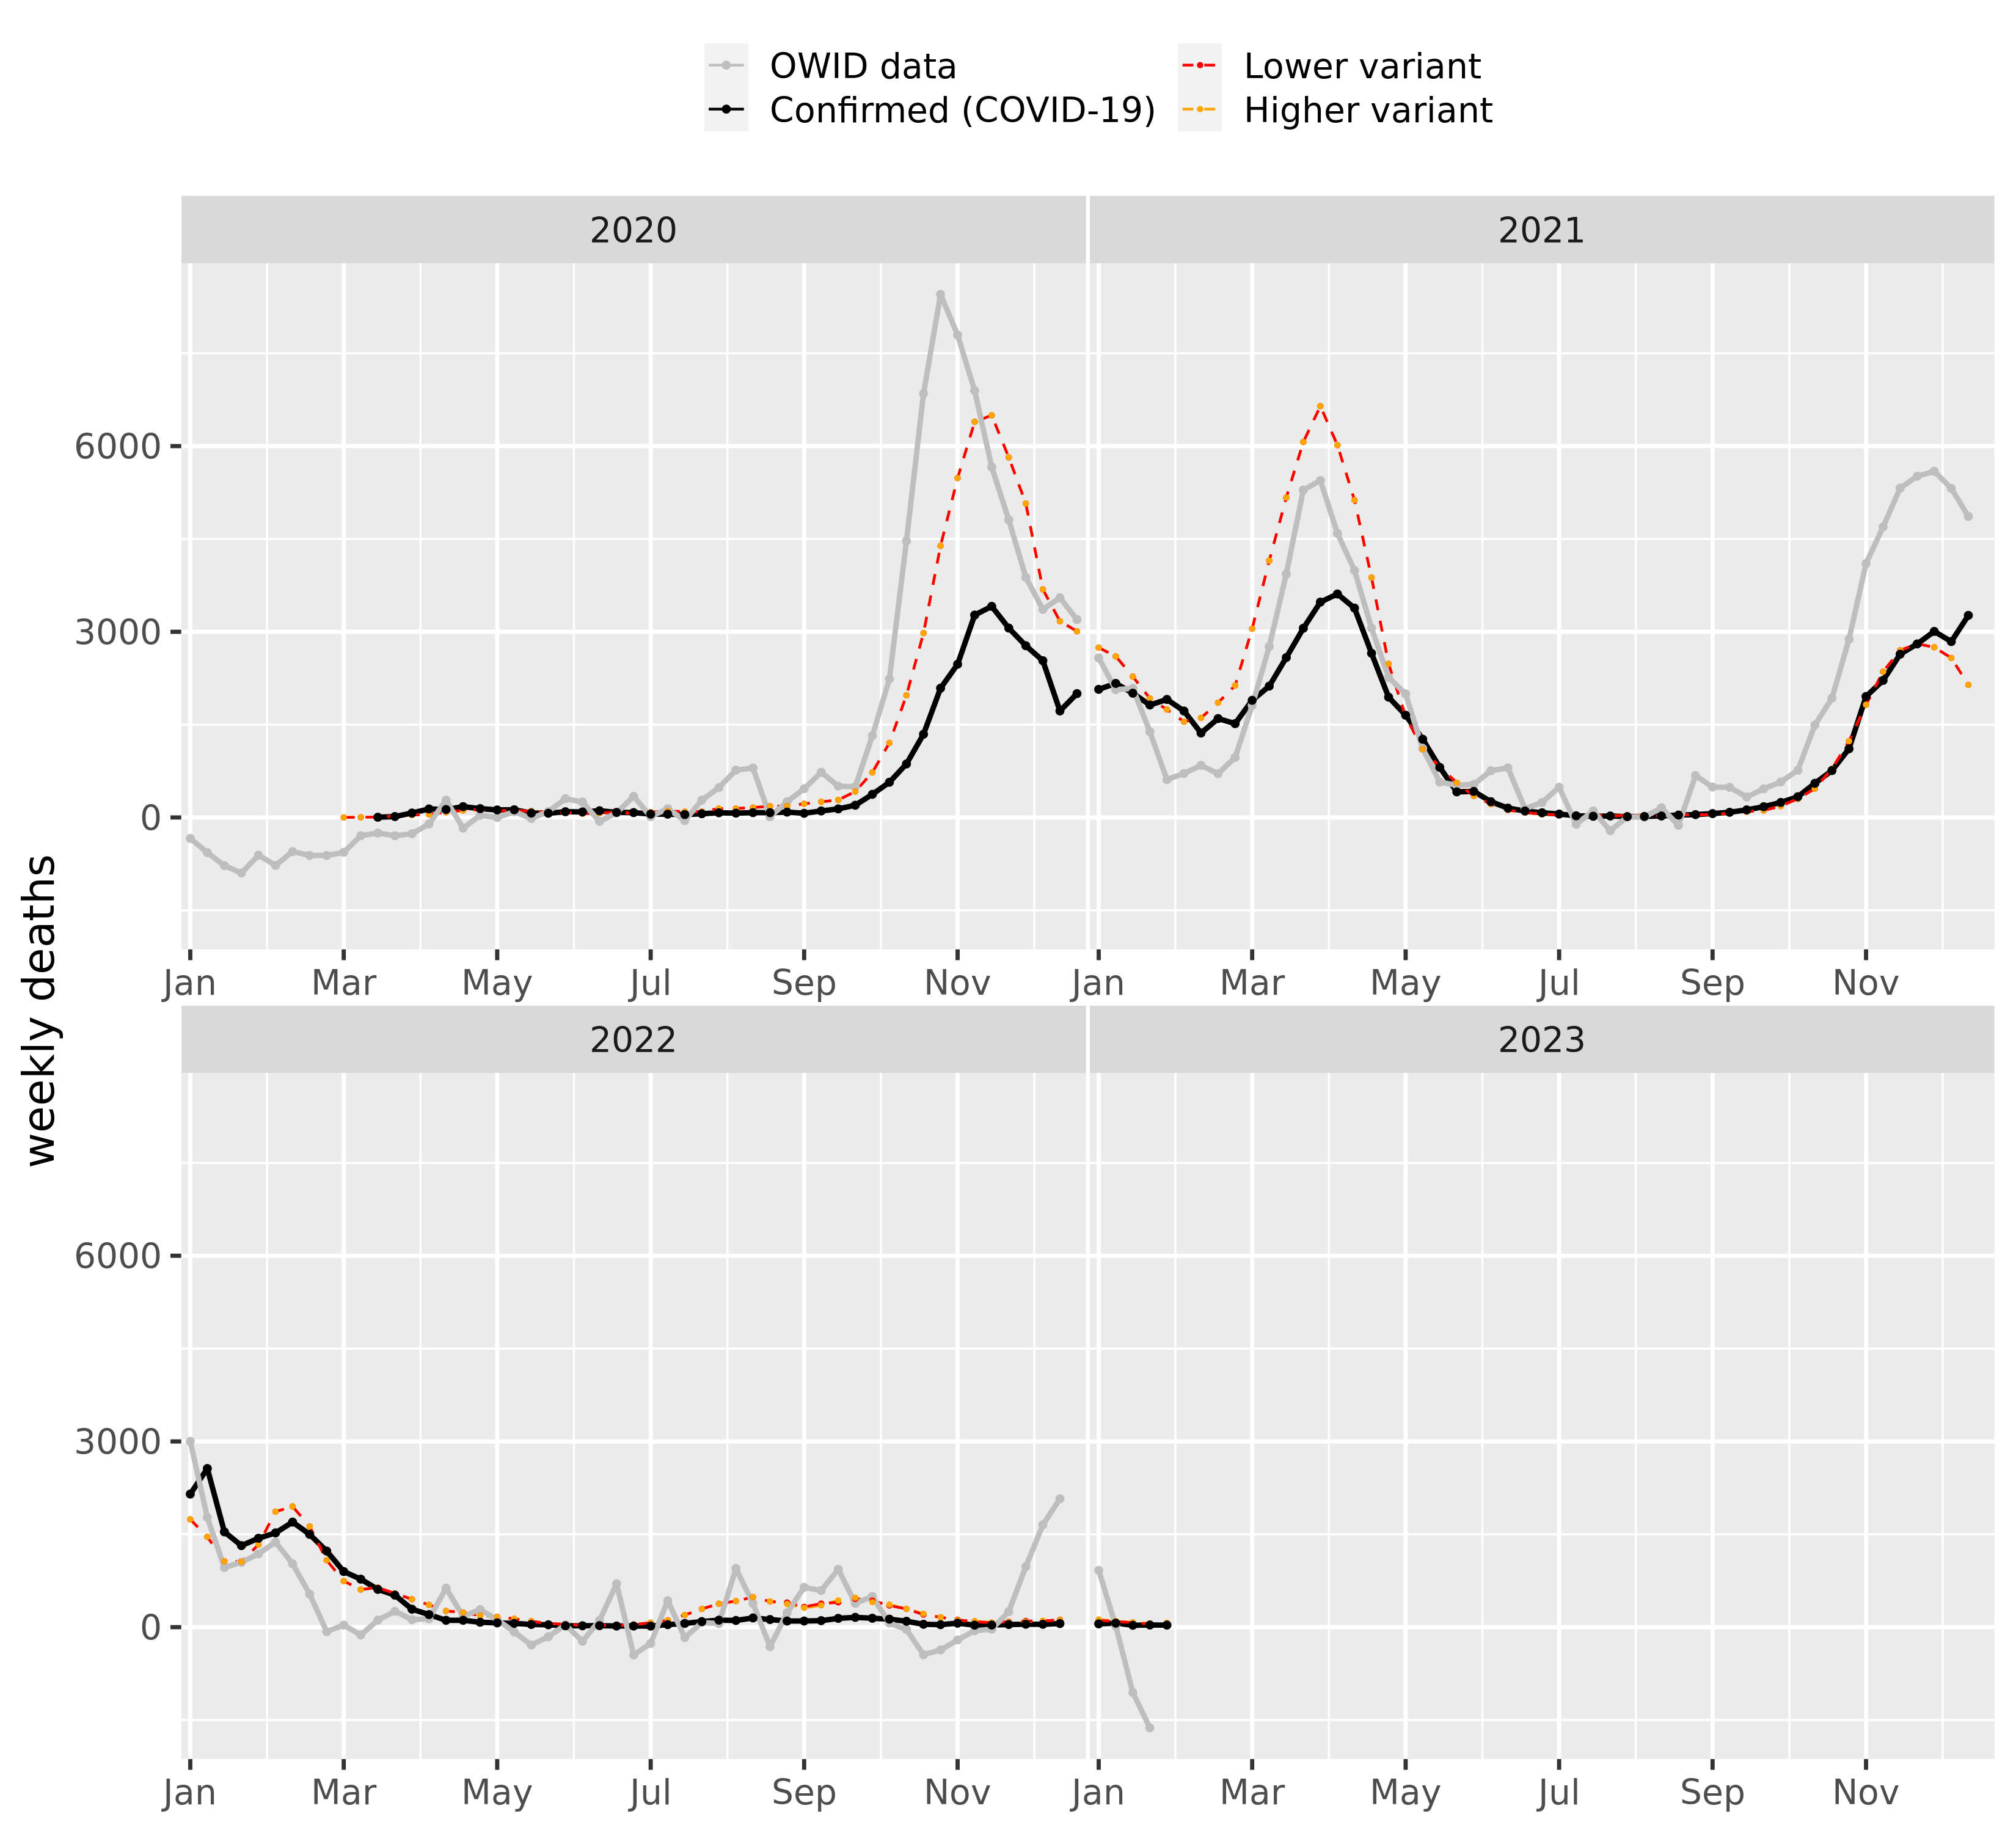
Excessive number of deaths
The plot below shows weekly deaths in our model, confirmed COVID-19 deaths and excessive number of deaths based on OWID data.
Data published at https://ourworldindata.org/coronavirus. Research and data: Edouard Mathieu, Hannah Ritchie, Lucas Rodés-Guirao, Cameron Appel, Daniel Gavrilov, Charlie Giattino, Joe Hasell, Bobbie Macdonald, Saloni Dattani, Diana Beltekian, Esteban Ortiz-Ospina, and Max Roser. Data published at https://ourworldindata.org/coronavirus. Research and data: Edouard Mathieu, Hannah Ritchie, Lucas Rodés-Guirao, Cameron Appel, Daniel Gavrilov, Charlie Giattino, Joe Hasell, Bobbie Macdonald, Saloni Dattani, Diana Beltekian, Esteban Ortiz-Ospina, and Max Roser.
Download the chart in high resolution.
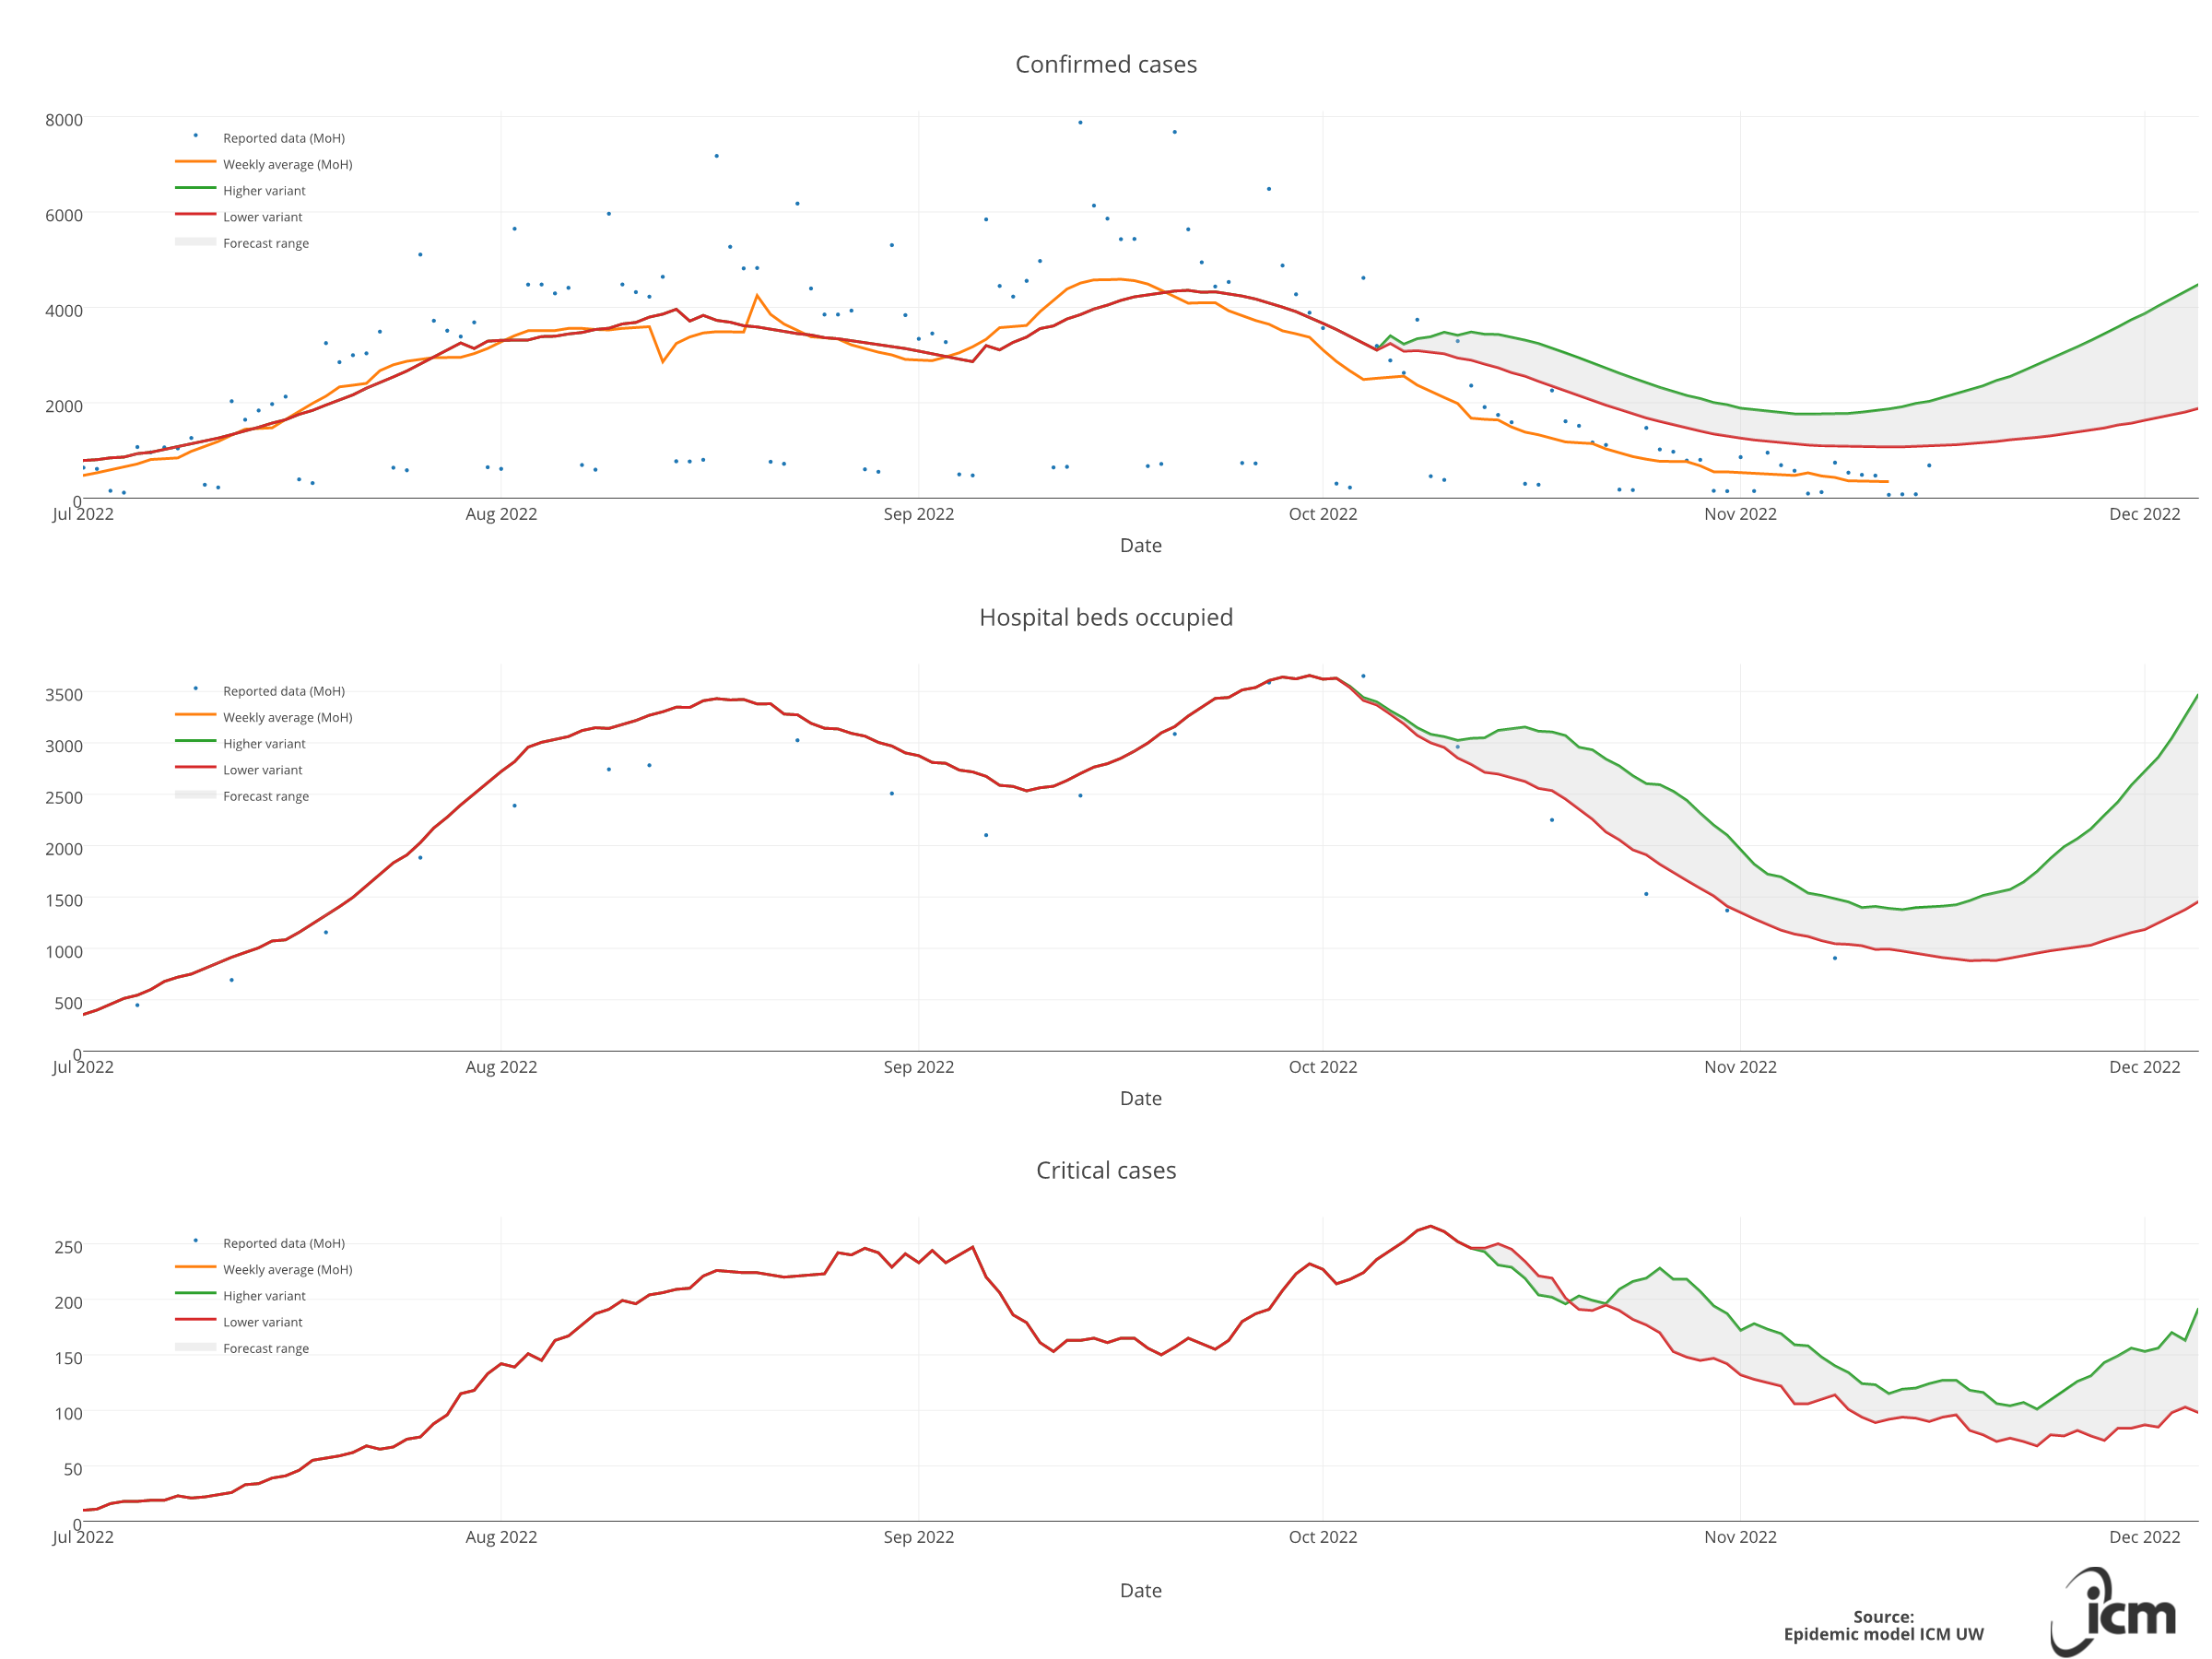
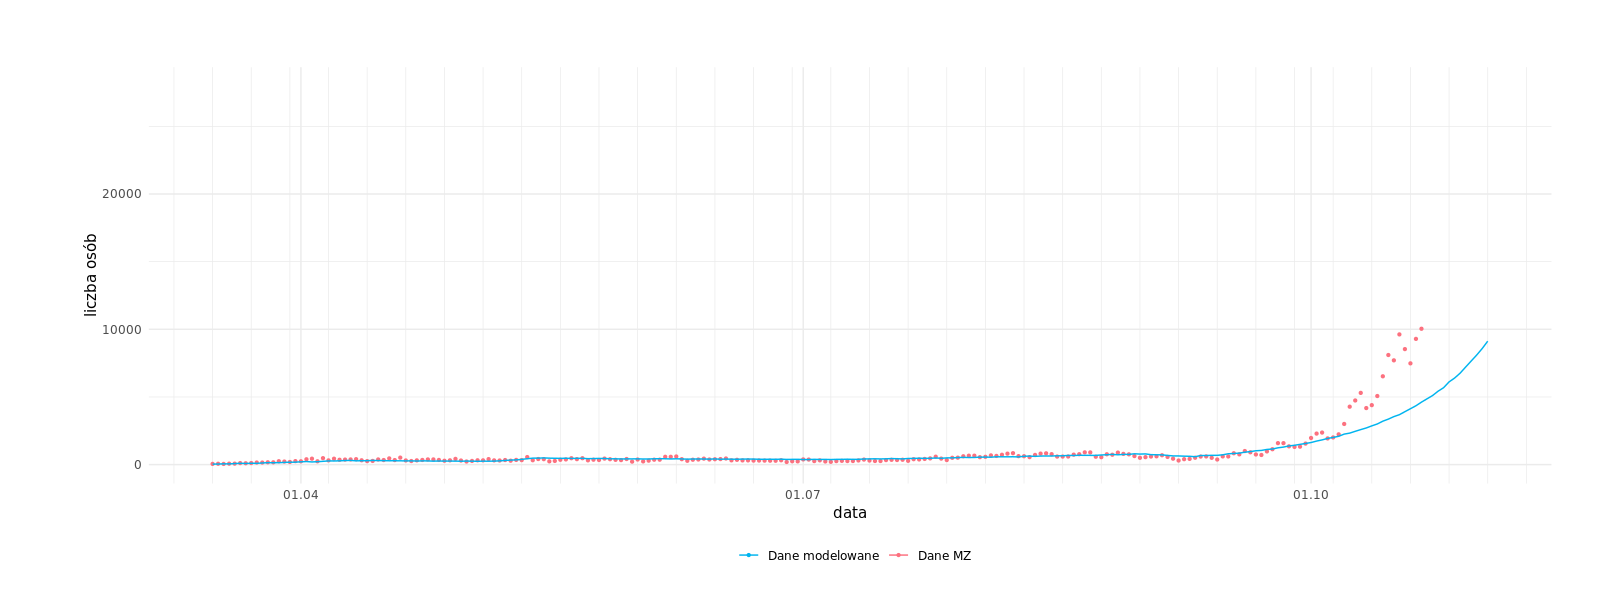
Dynamic chart of identified cases of Covid-19 infection in the period from March 16, 2020 with a prediction to January 31, 2023.
Chart prepared on the basis of the forecast of November 10, 2022.
The current forecast takes into account all historically introduced restrictions and relaxations, partly the increase in mobility and contact related to the influx of refugees, the seasonality effect, the impact of holidays, declining immunity and the beginning of the school and academic year. The forecast includes sub-variant BA2 of the omicron variant, sub-variants BA4/BA5 and sub-variant BQ.1/BQ.1.1 in two options: optimistic and pessimistic cross-resistance with the previous variant. We anticipate that the next wave will be dominated by infections of the BQ.1/BQ.1.1 subvariant and the increases may start in December or as late as next year.
Numbers of identified cases (data reported by Ministry of Health) from February 8, 2022 are given together with reinfections. The daily number of hospitalizations is not reported from April 1, 2022, from April 12, it is reported every week. Numbers of occupied ICU beds are not reported from April 1, 2022, therefore, the plots of occupied ICU beds are uncalibrated.
Download full resolution chart
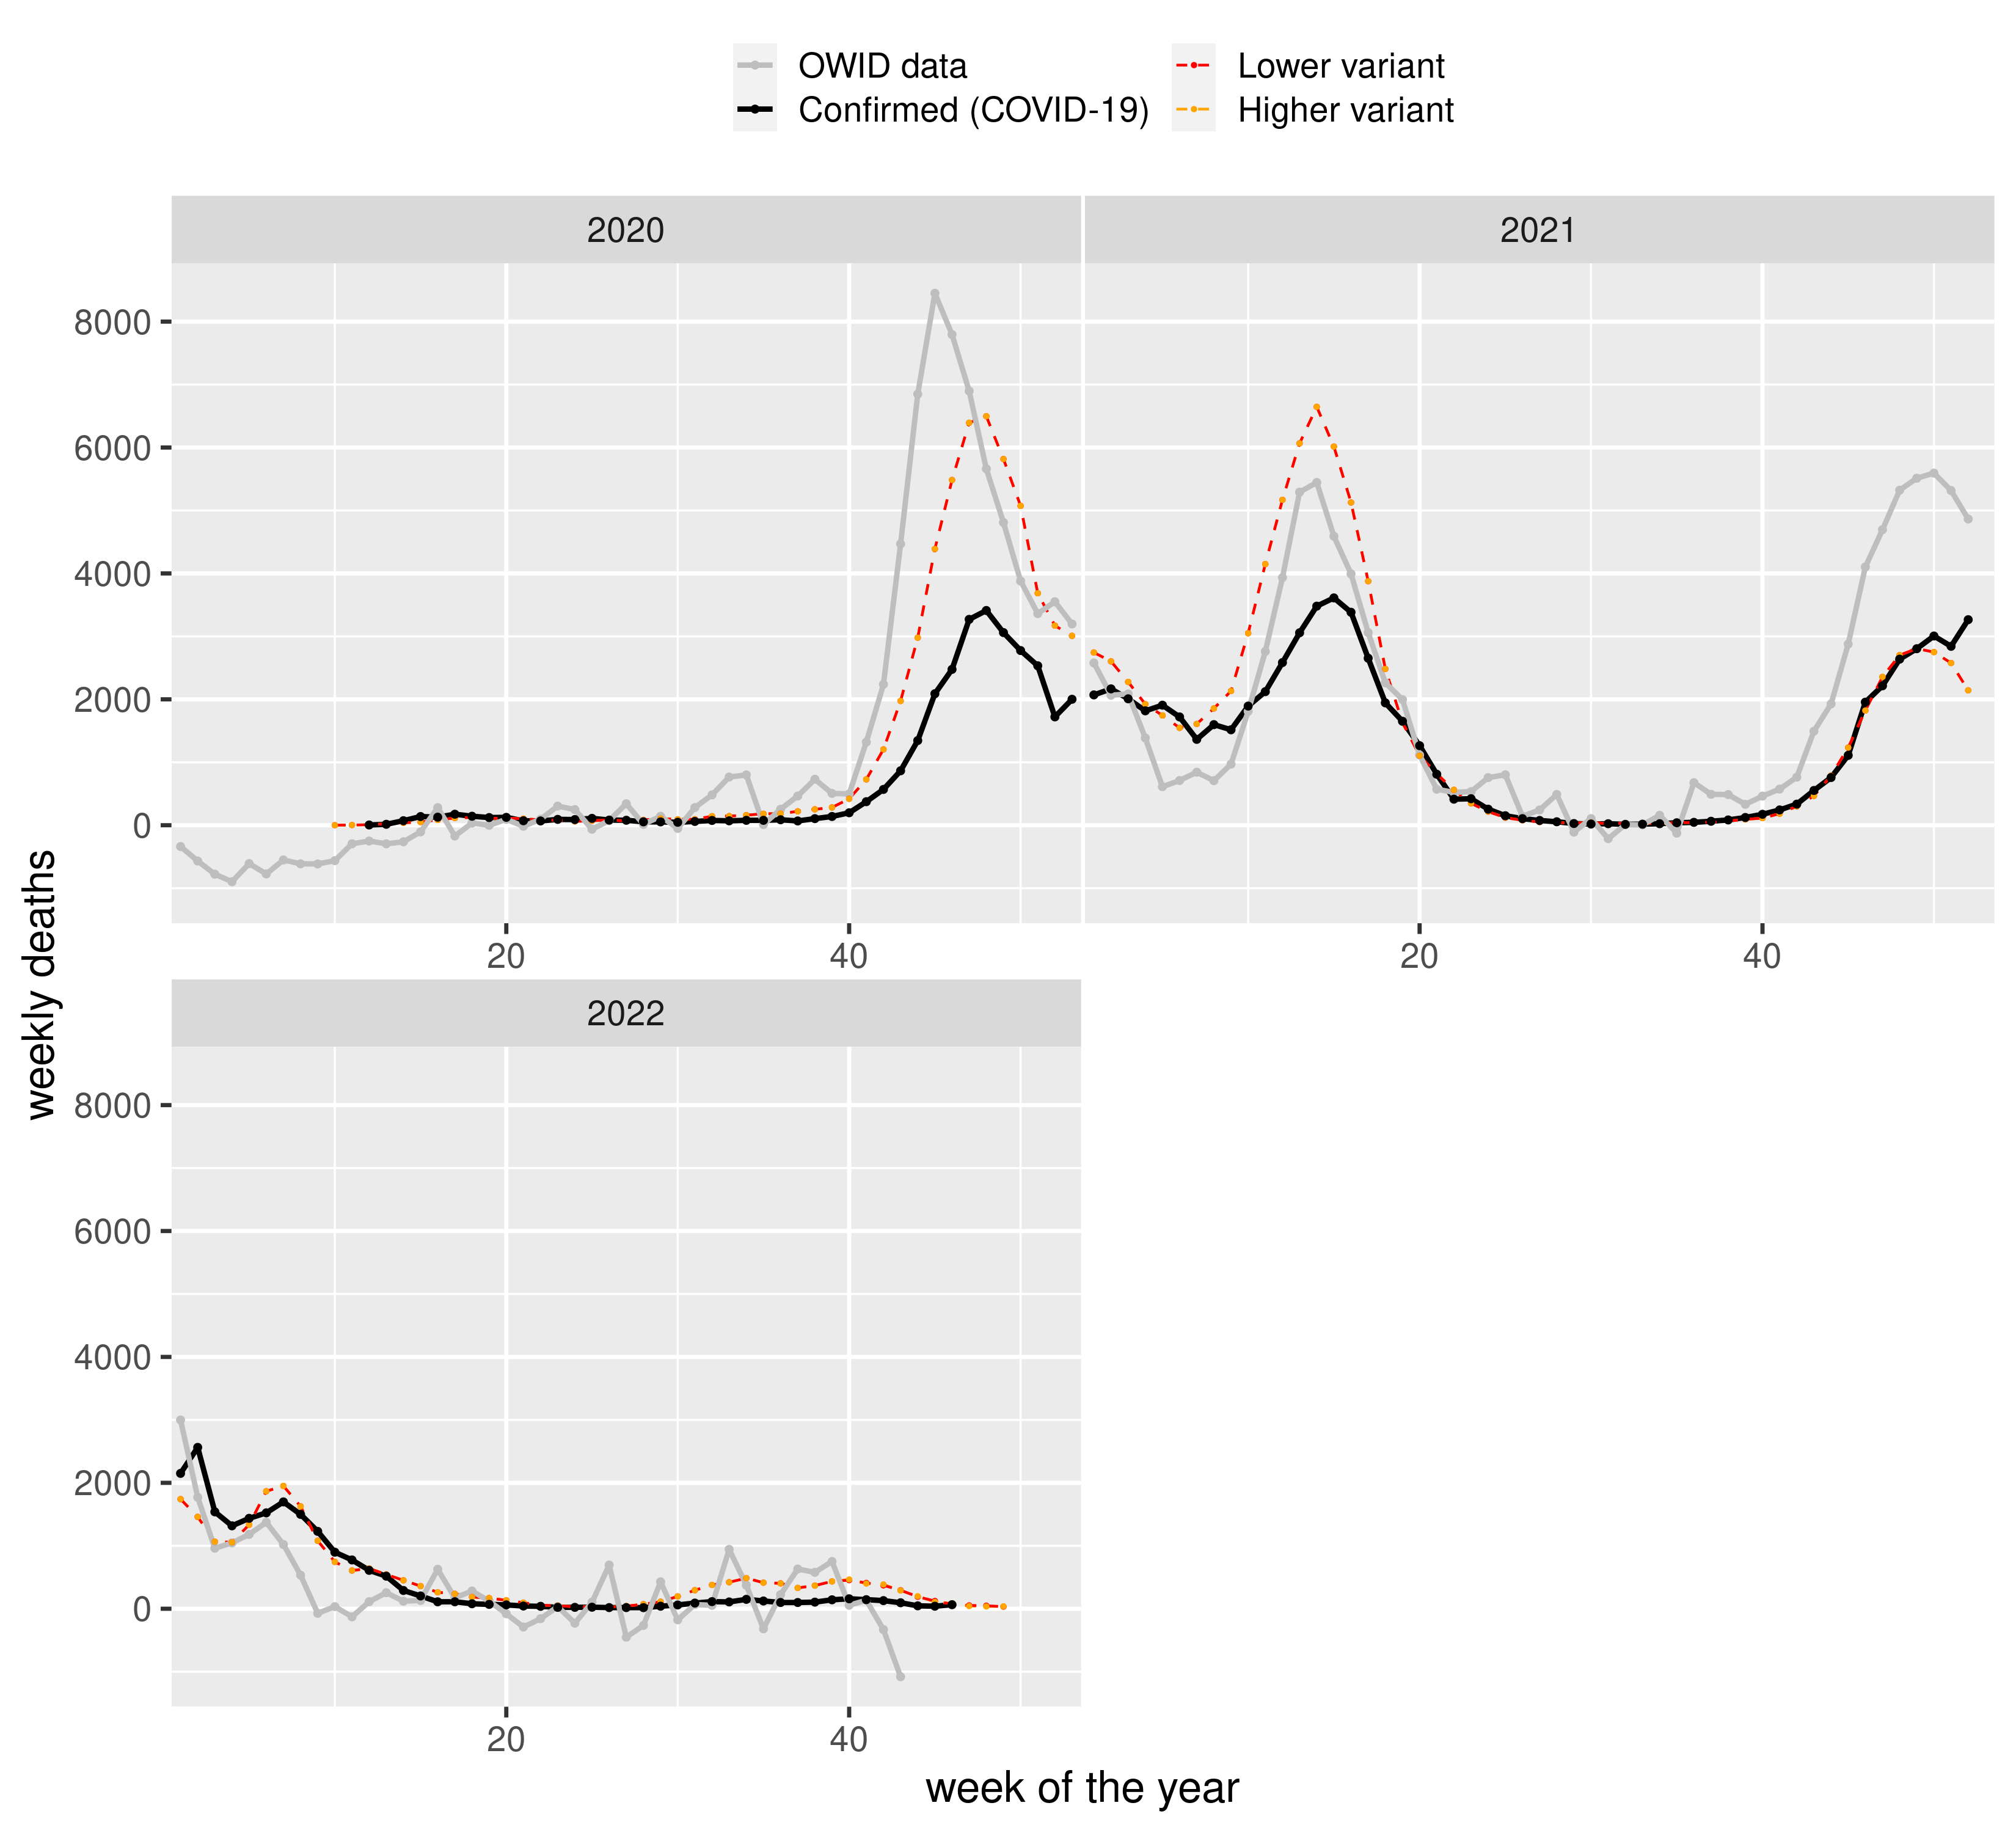
Excessive number of deaths
The plot below shows weekly deaths in our model, confirmed COVID-19 deaths and excessive number of deaths based on OWID data.
Data published at https://ourworldindata.org/coronavirus. Research and data: Edouard Mathieu, Hannah Ritchie, Lucas Rodés-Guirao, Cameron Appel, Daniel Gavrilov, Charlie Giattino, Joe Hasell, Bobbie Macdonald, Saloni Dattani, Diana Beltekian, Esteban Ortiz-Ospina, and Max Roser.
Dynamic chart of identified cases of Covid-19 infection in the period from March 16, 2020 with a prediction to December 5, 2022.
Chart prepared on the basis of the forecast of October 3, 2022.
The current forecast takes into account all historically introduced restrictions and easing, partly the increase in mobility and contact related to the influx of refugees, the seasonal effect, the impact of holidays, declining resilience and beginning of the school and academic year. The forecast takes into account the BA2 sub-variant of the omicron variant and BA4/BA5 sub-variants.
The scenarios for the development of the epidemic are presented assuming the population resistance of approximately 60% of survivors as of January 1, 2022.
Numbers of identified cases (data reported by Ministry of Health) from February 8, 2022 are given together with reinfections. The daily number of hospitalizations is not reported from April 1, 2022, from April 12, it is reported every week. Numbers of occupied ICU beds are not reported from April 1, 2022, therefore, the plots of occupied ICU beds are uncalibrated.
Approximately 22 million people who received at least one dose of the vaccine and 10 million who received a booster dose were vaccinated. Data updated on January 25, 2022.
Download full resolution chart
Excessive number of deaths
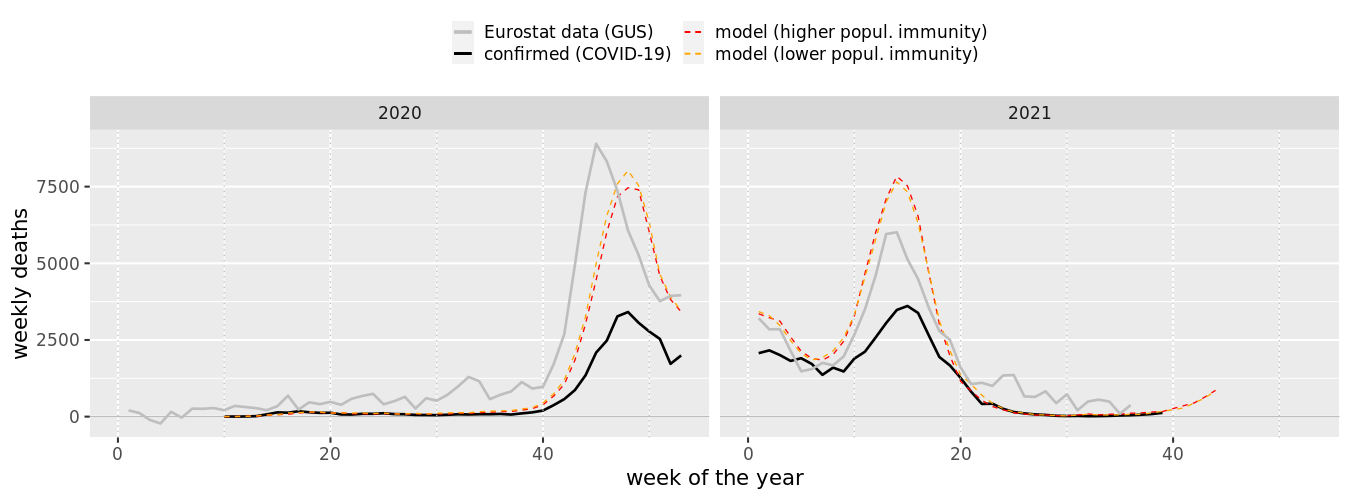
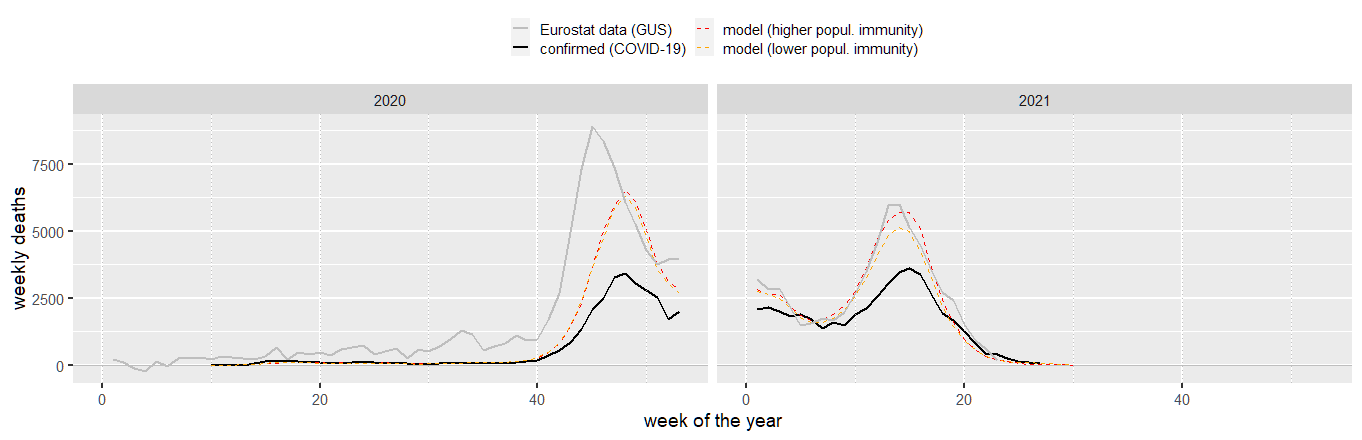
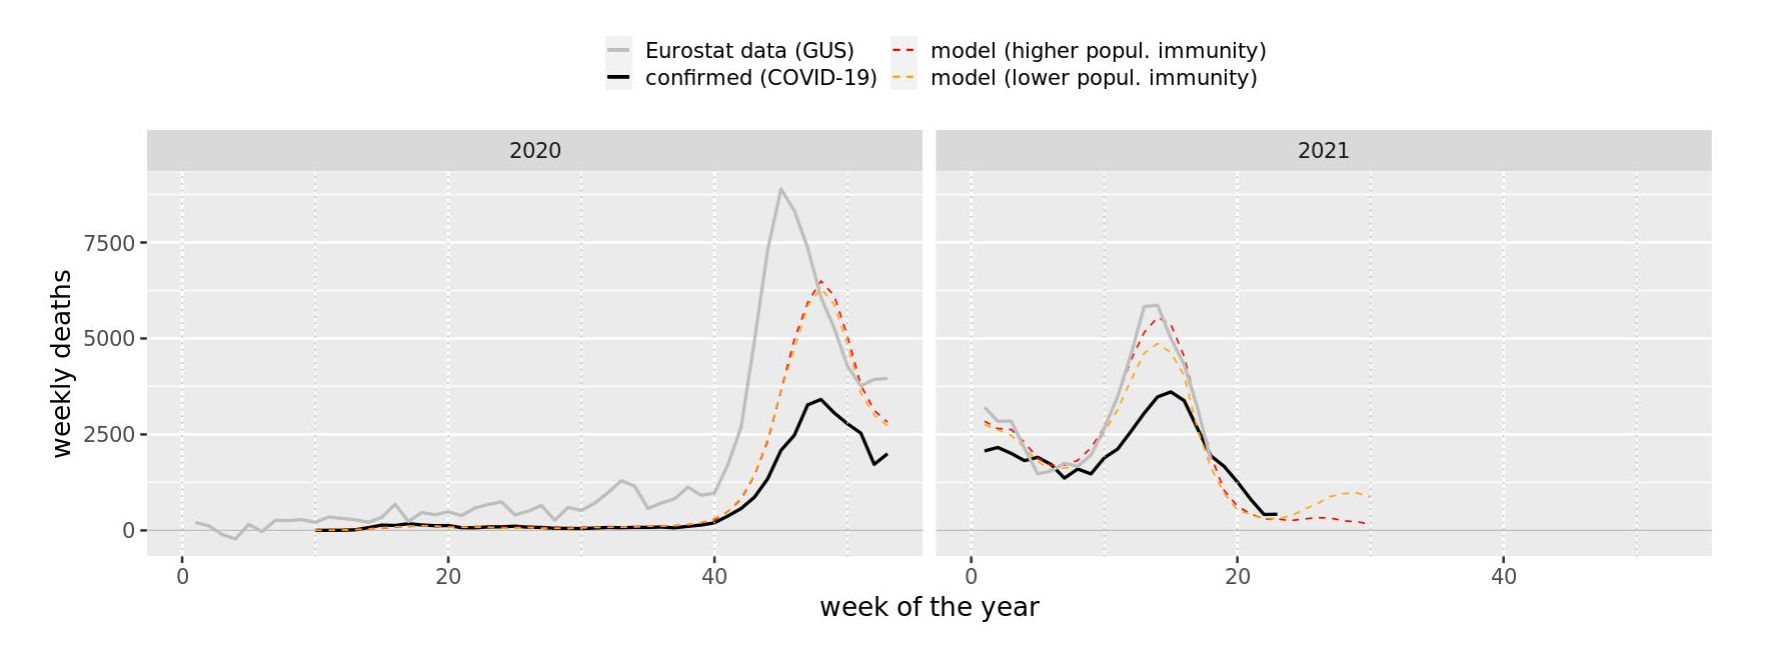
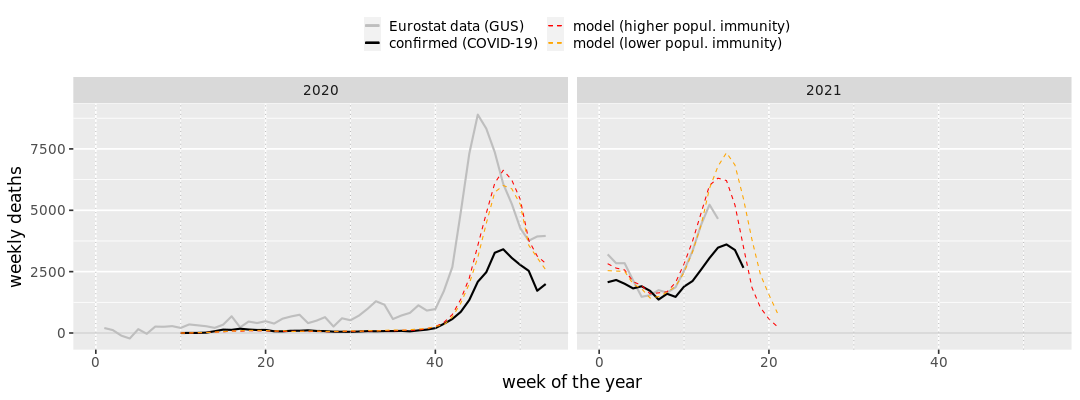
The plot below shows weekly deaths in our model, confirmed COVID-19 deaths and excessive number of deaths based on Eurostat (GUS) data (avg. weekly deaths 2010-2019 substracted from weekly deaths 2020 and 2021).
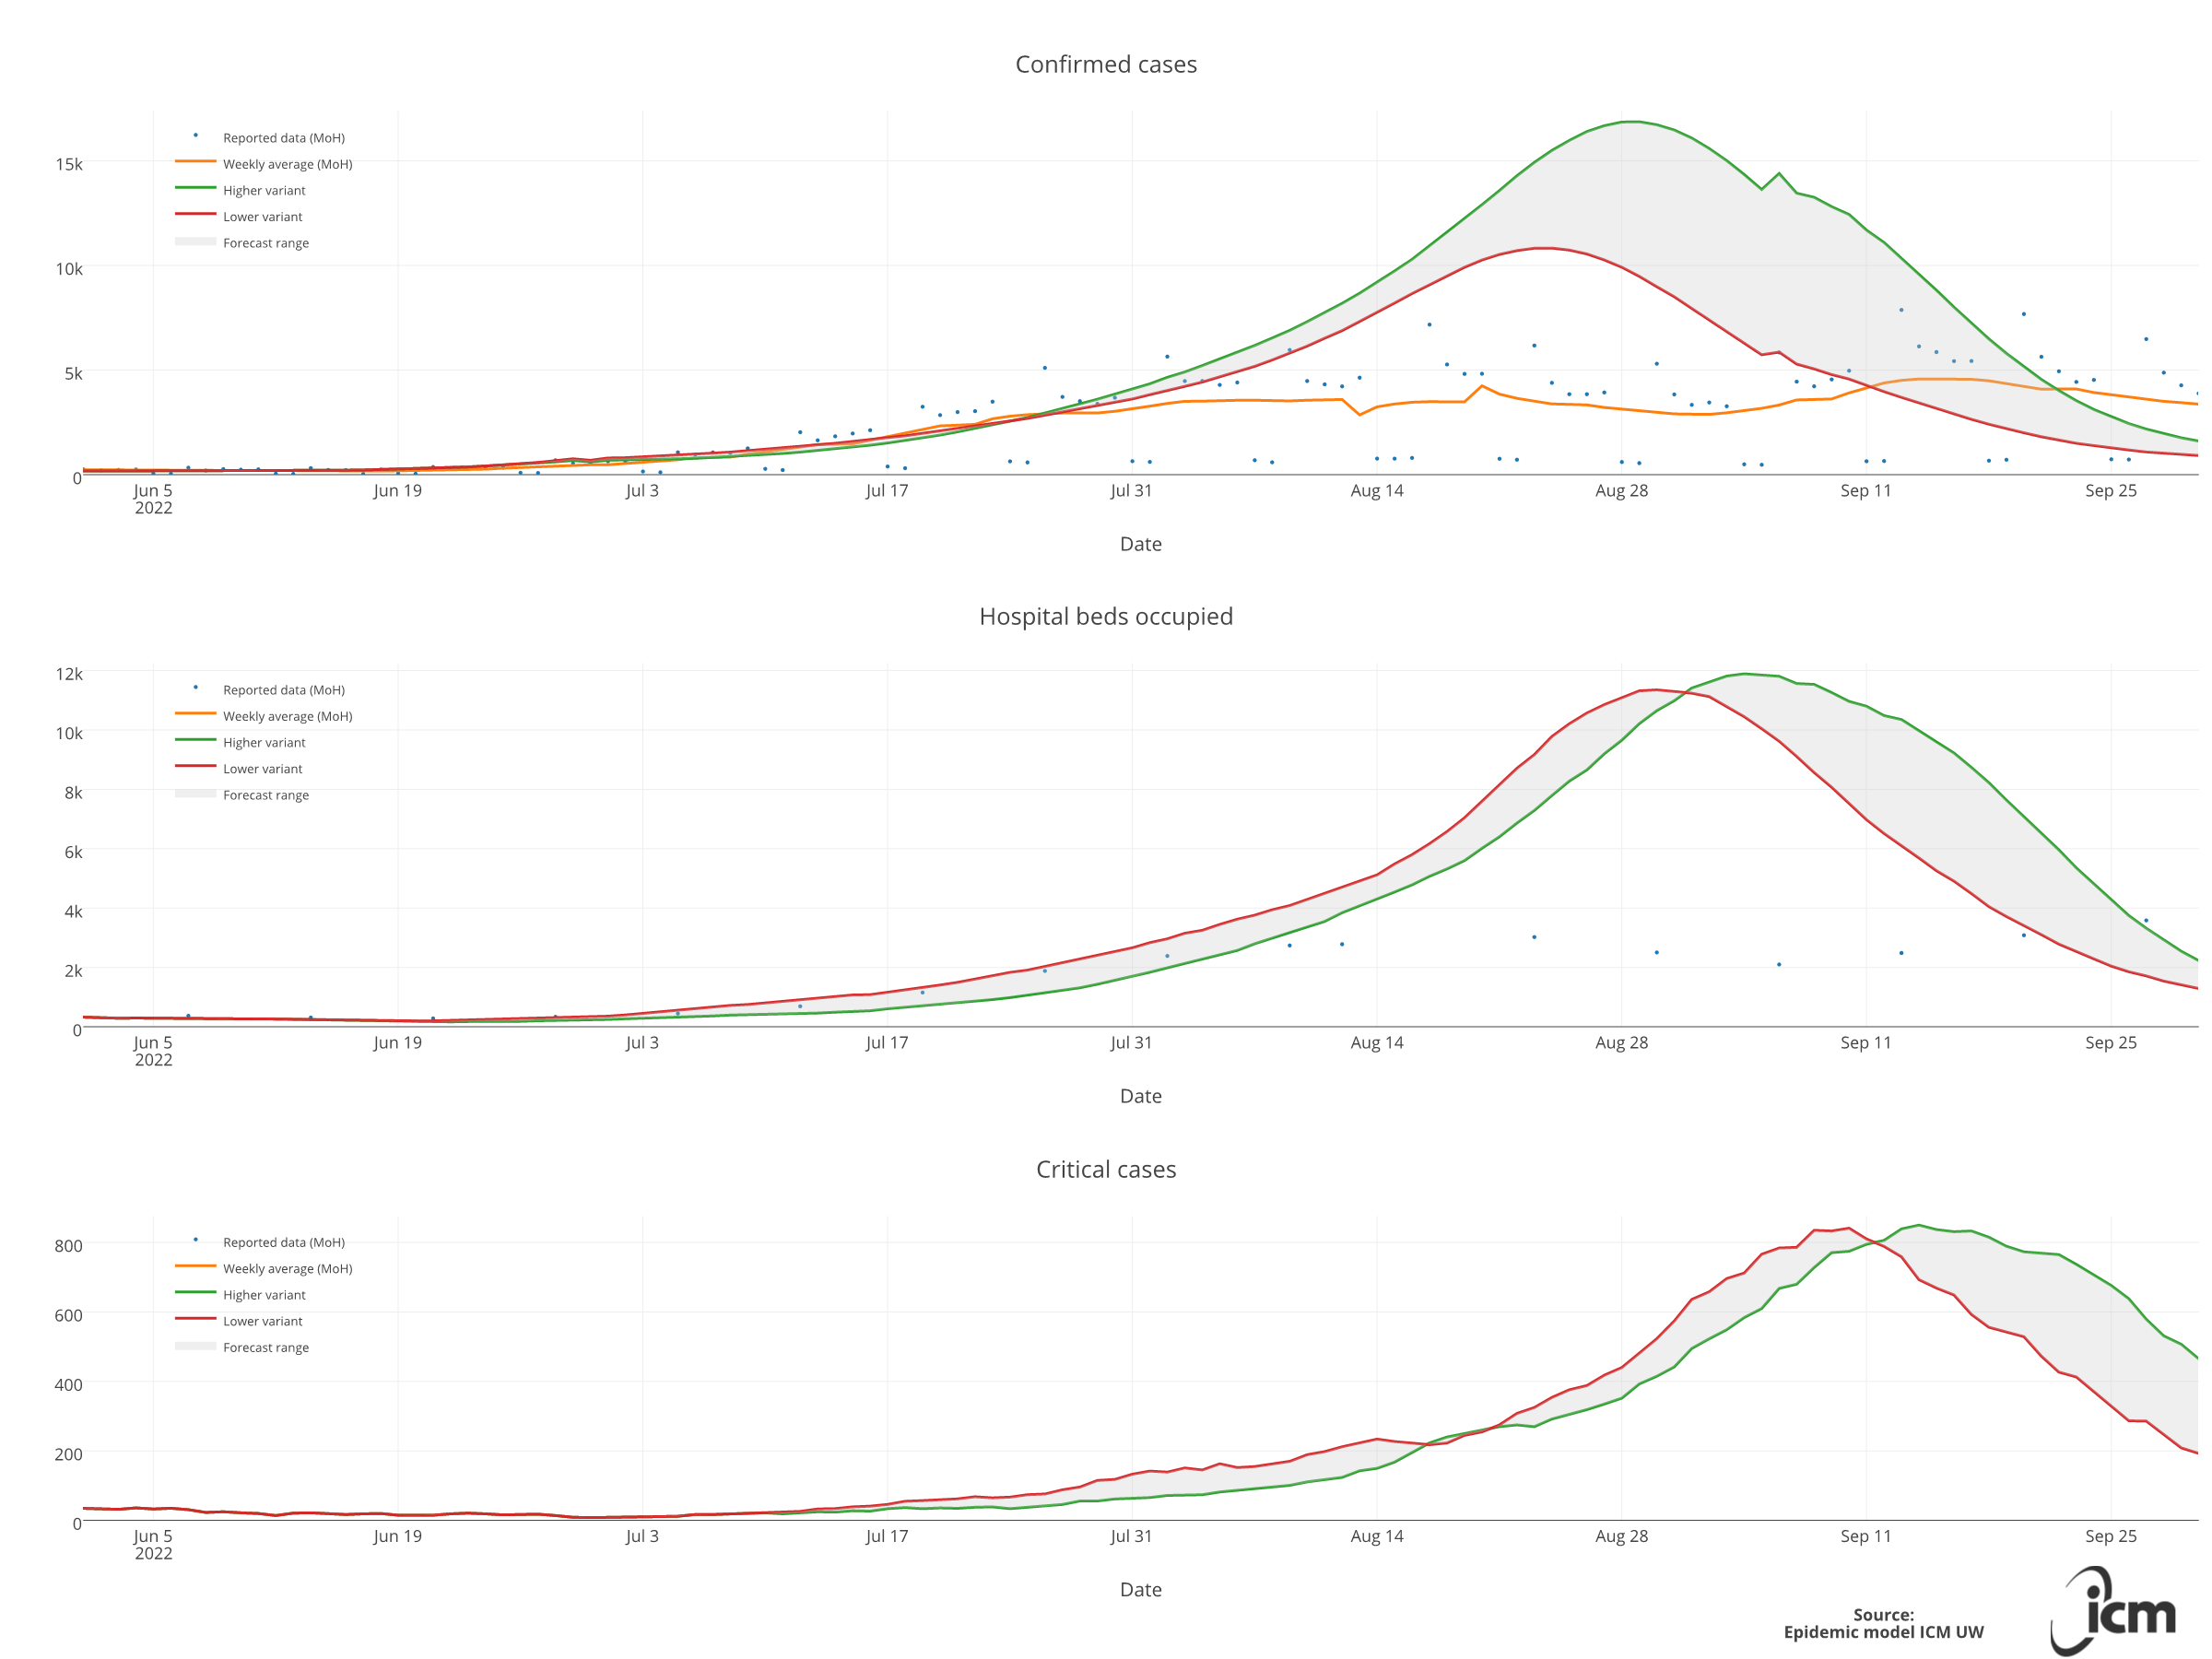
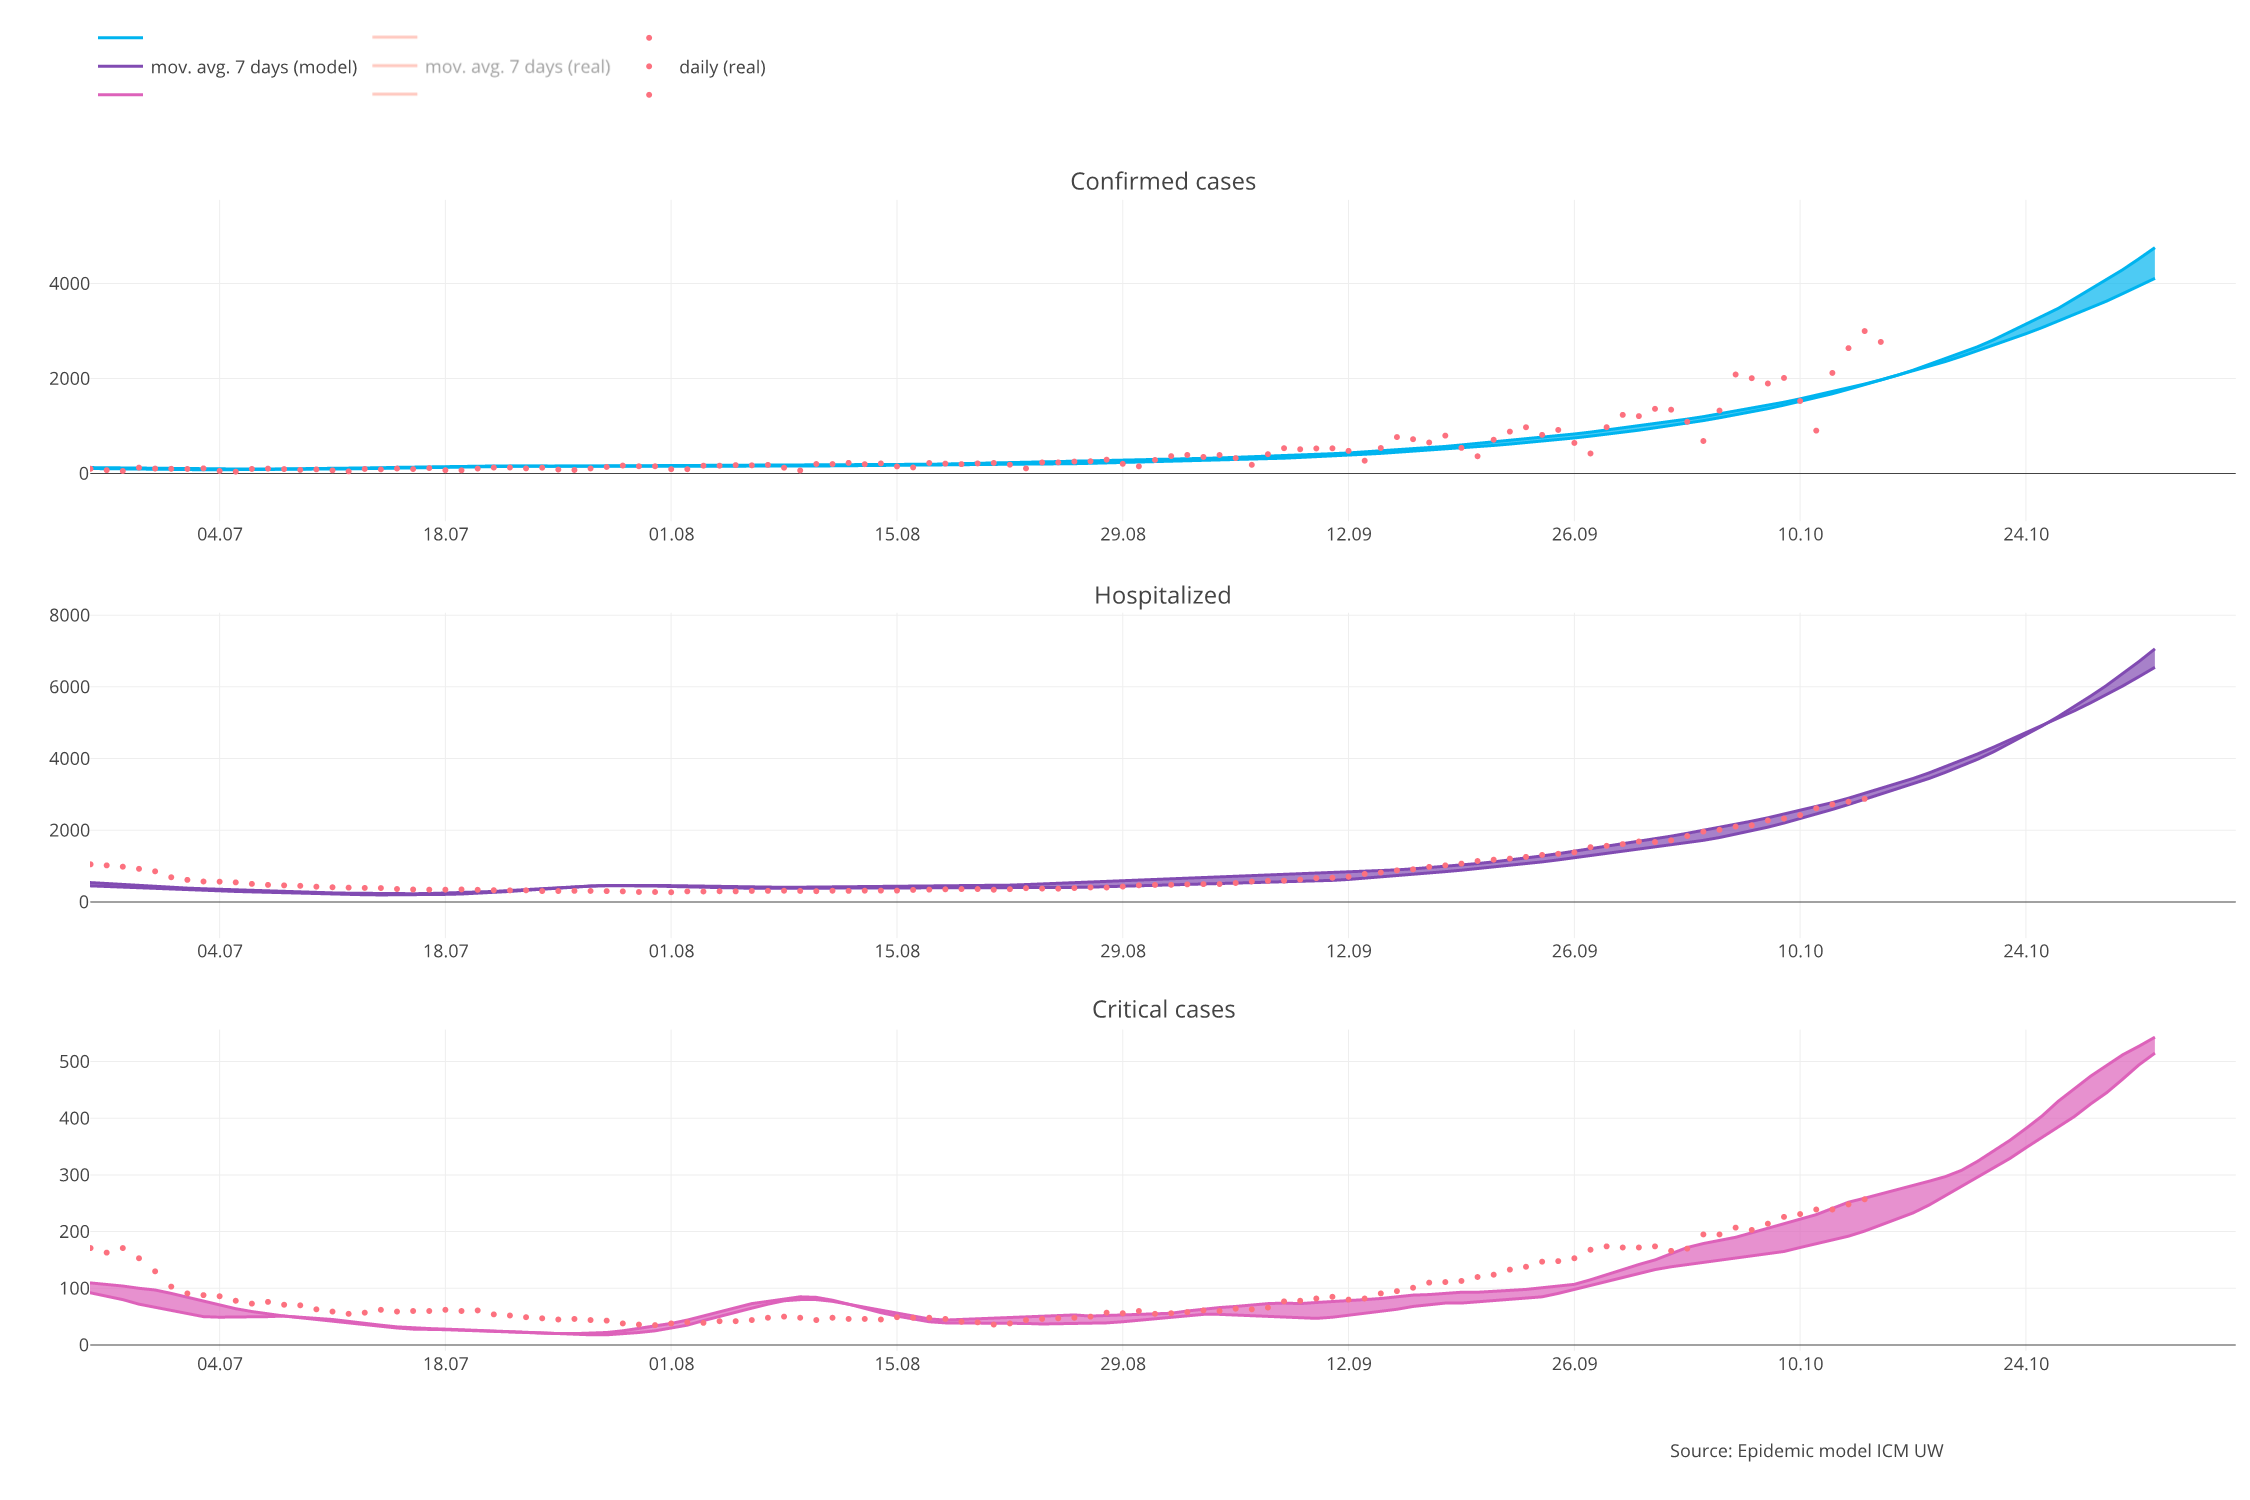
Dynamic chart of identified cases of Covid-19 infection in the period from March 16, 2020 with a prediction to September 30, 2022.
Chart prepared on the basis of the forecast of July 29, 2022.
The current forecast takes into account all historically introduced restrictions and easing, partly the increase in mobility and contact related to the influx of refugees, the seasonal effect, the impact of holidays and declining resilience. The forecast takes into account the BA2 sub-variant of the omicron variant and BA4/BA5 sub-variants.
The scenarios for the development of the epidemic are presented assuming the population resistance of approximately 60% of survivors as of January 1, 2022.
Numbers of identified cases (data reported by Ministry of Health) from February 8, 2022 are given together with reinfections. The daily number of hospitalizations is not reported from April 1, 2022, from April 12, it is reported every week. Numbers of occupied ICU beds are not reported from April 1, 2022, therefore, the plots of occupied ICU beds are uncalibrated.
Approximately 22 million people who received at least one dose of the vaccine and 10 million who received a booster dose were vaccinated. Data updated on January 25, 2022
Download full resolution chart
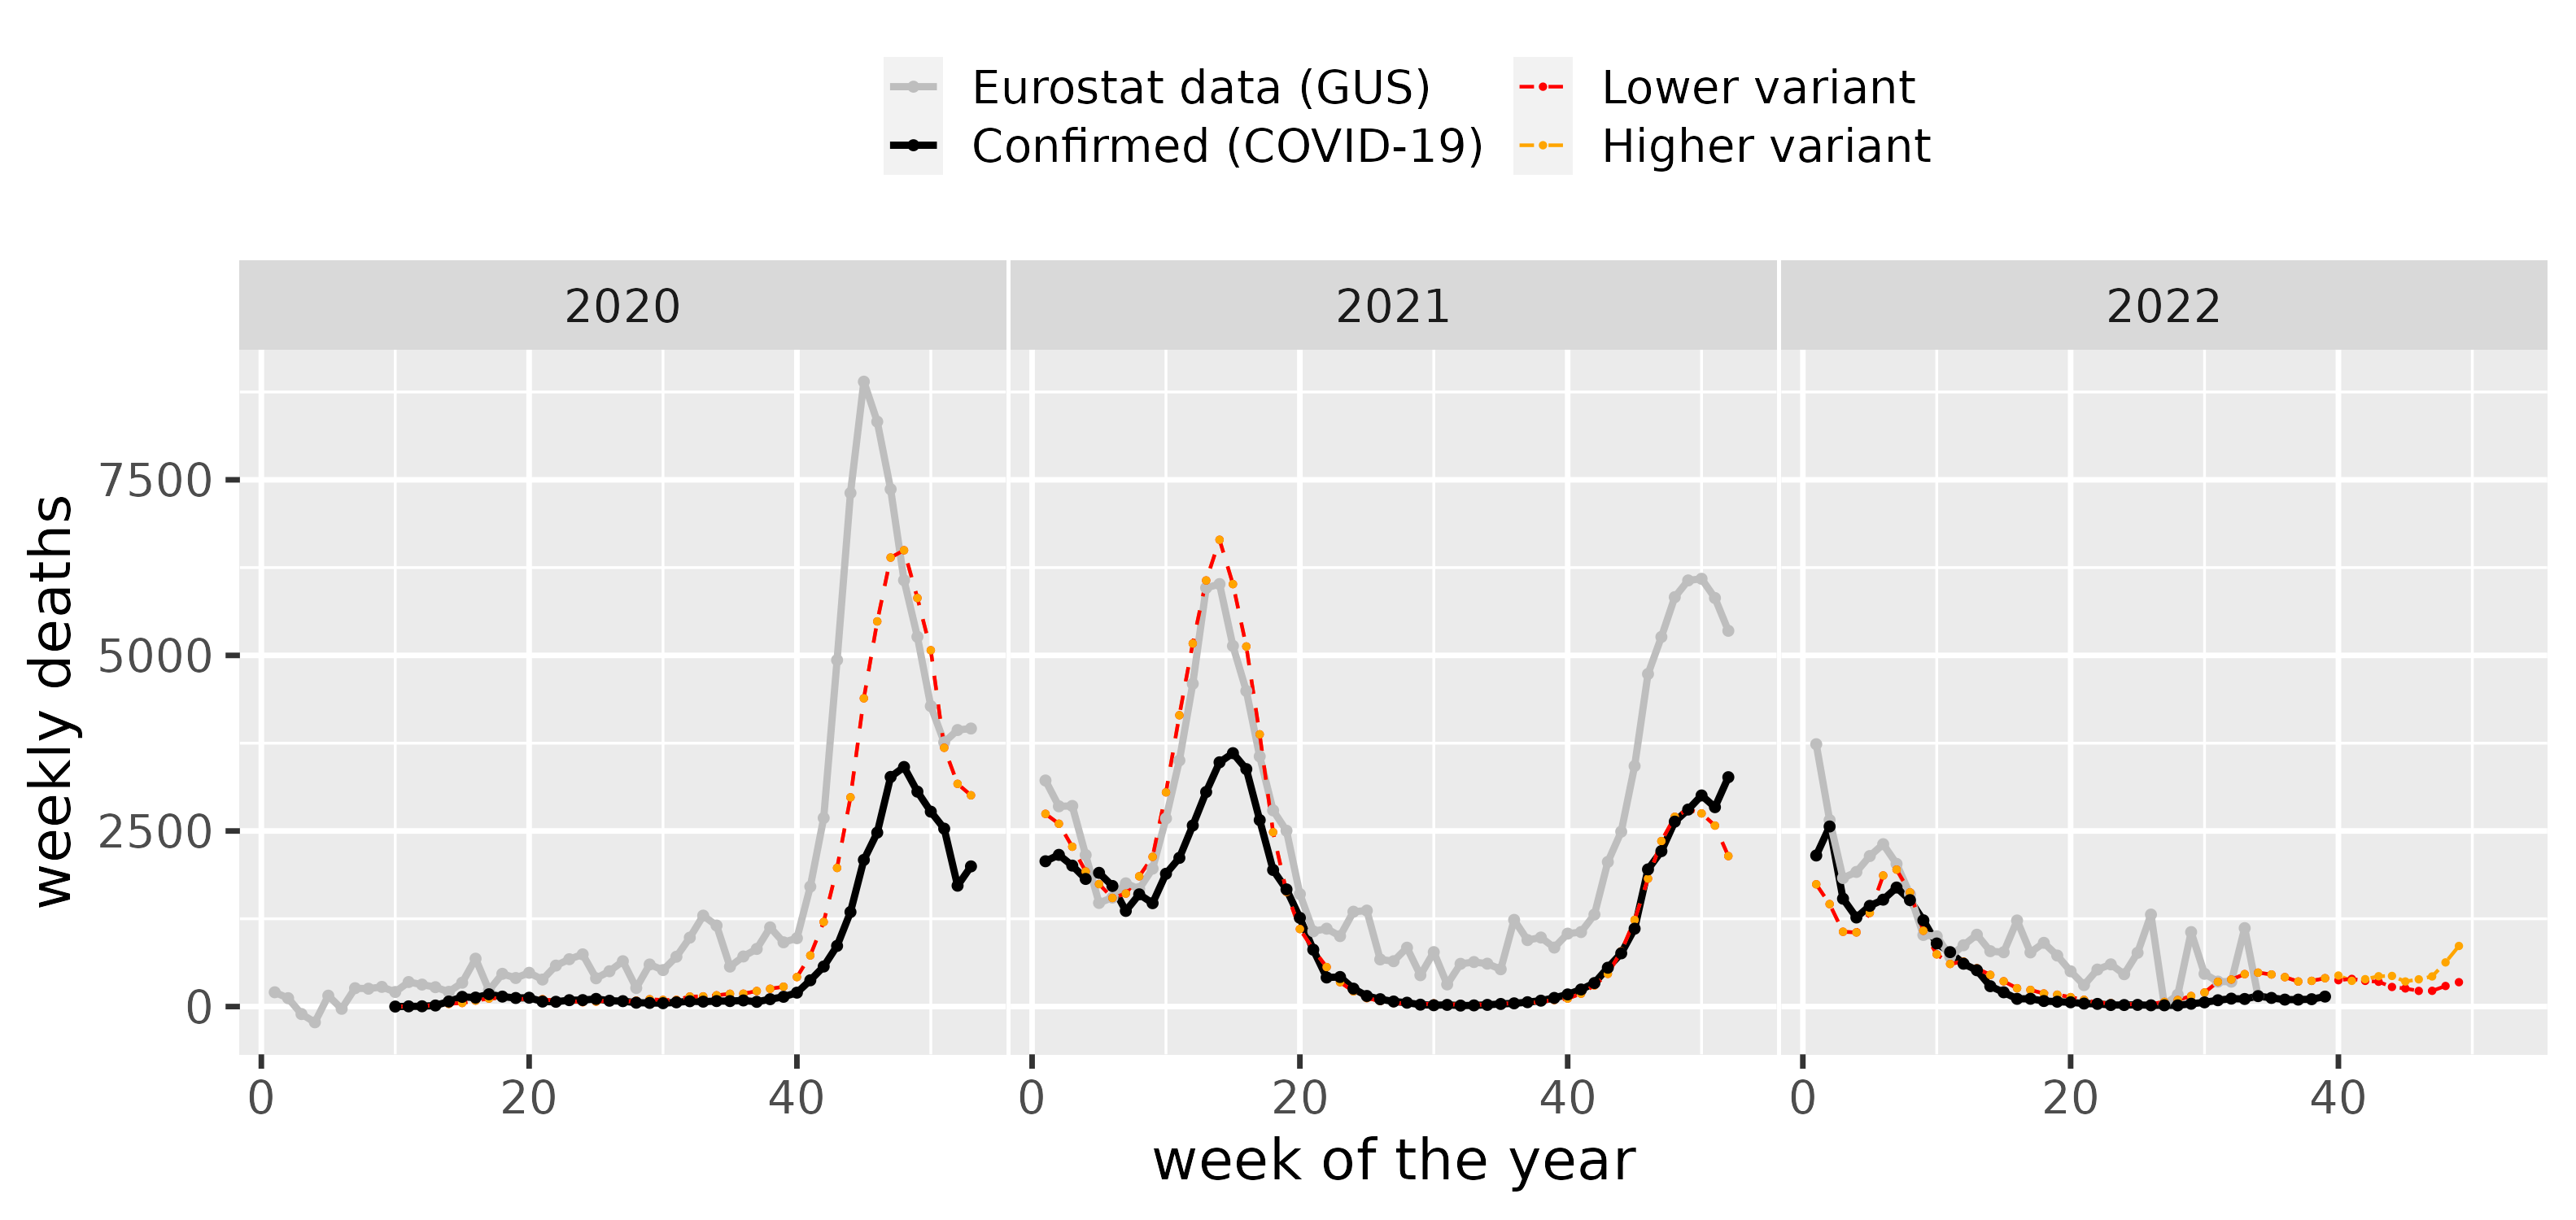
Excessive number of deaths
The plot below shows weekly deaths in our model, confirmed COVID-19 deaths and excessive number of deaths based on Eurostat (GUS) data (avg. weekly deaths 2010-2019 substracted from weekly deaths 2020 and 2021).
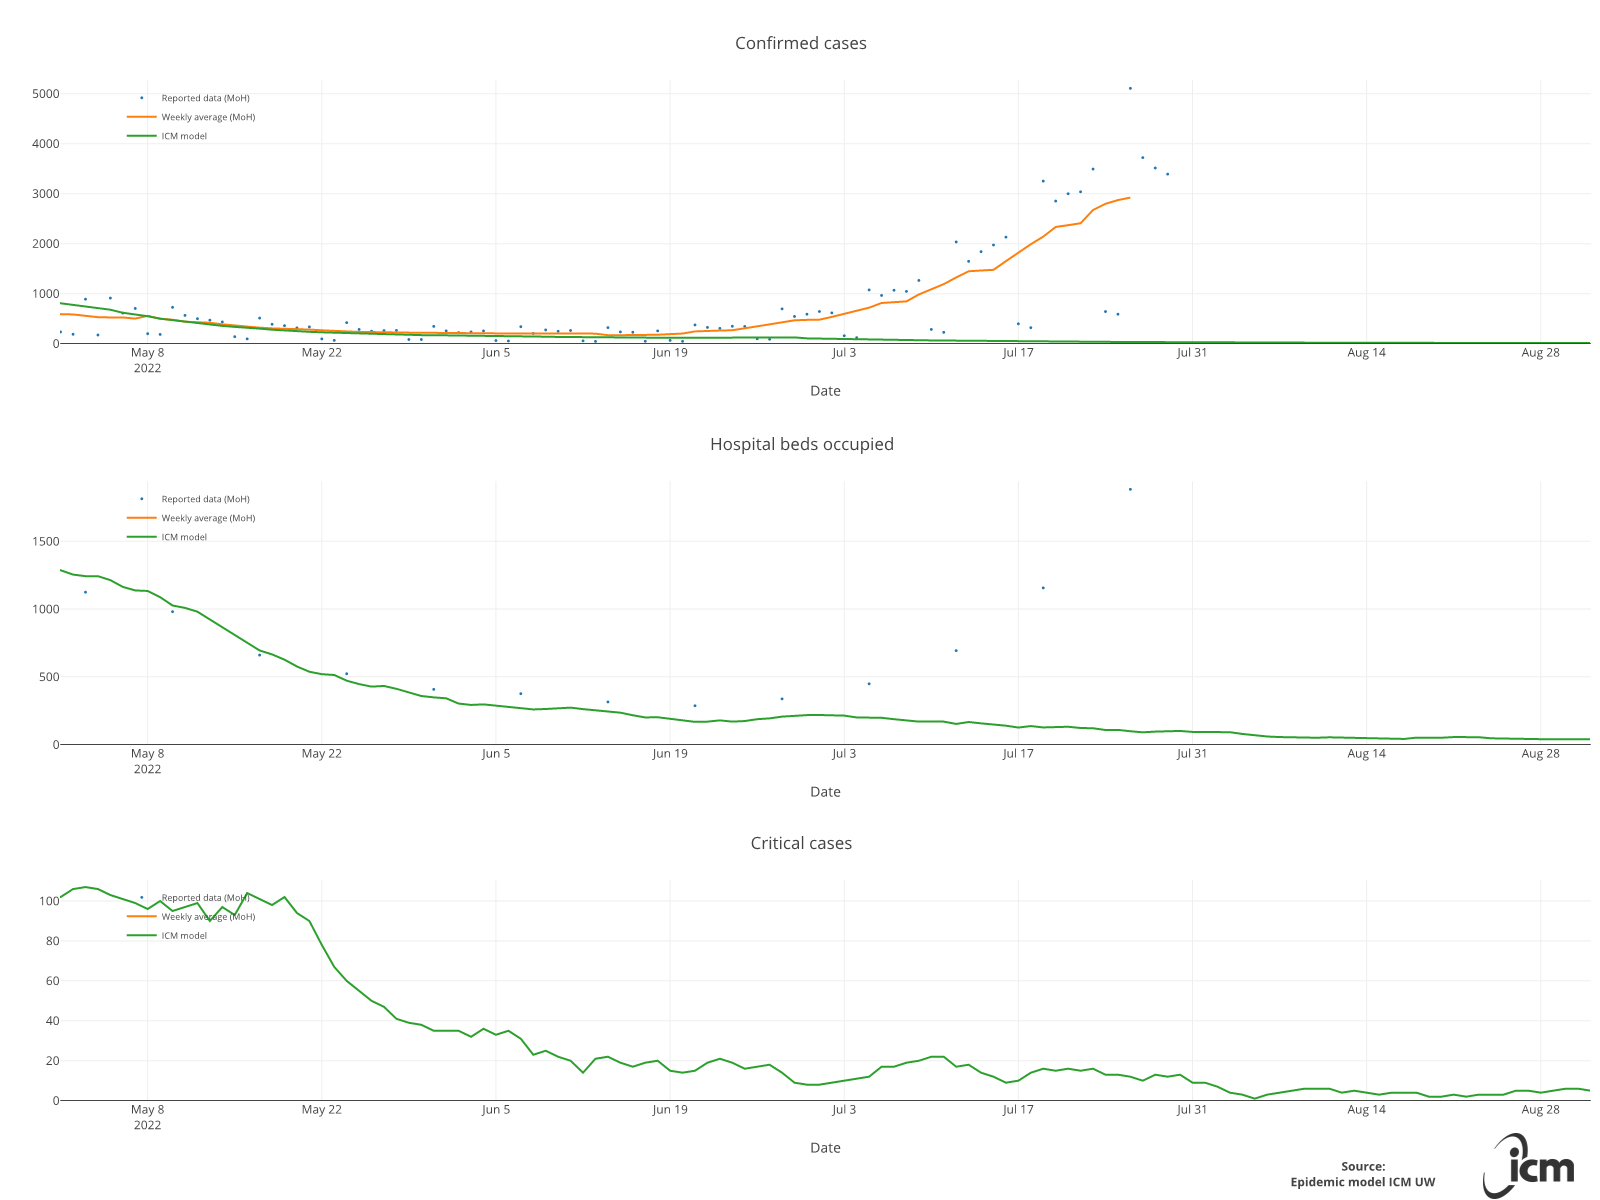
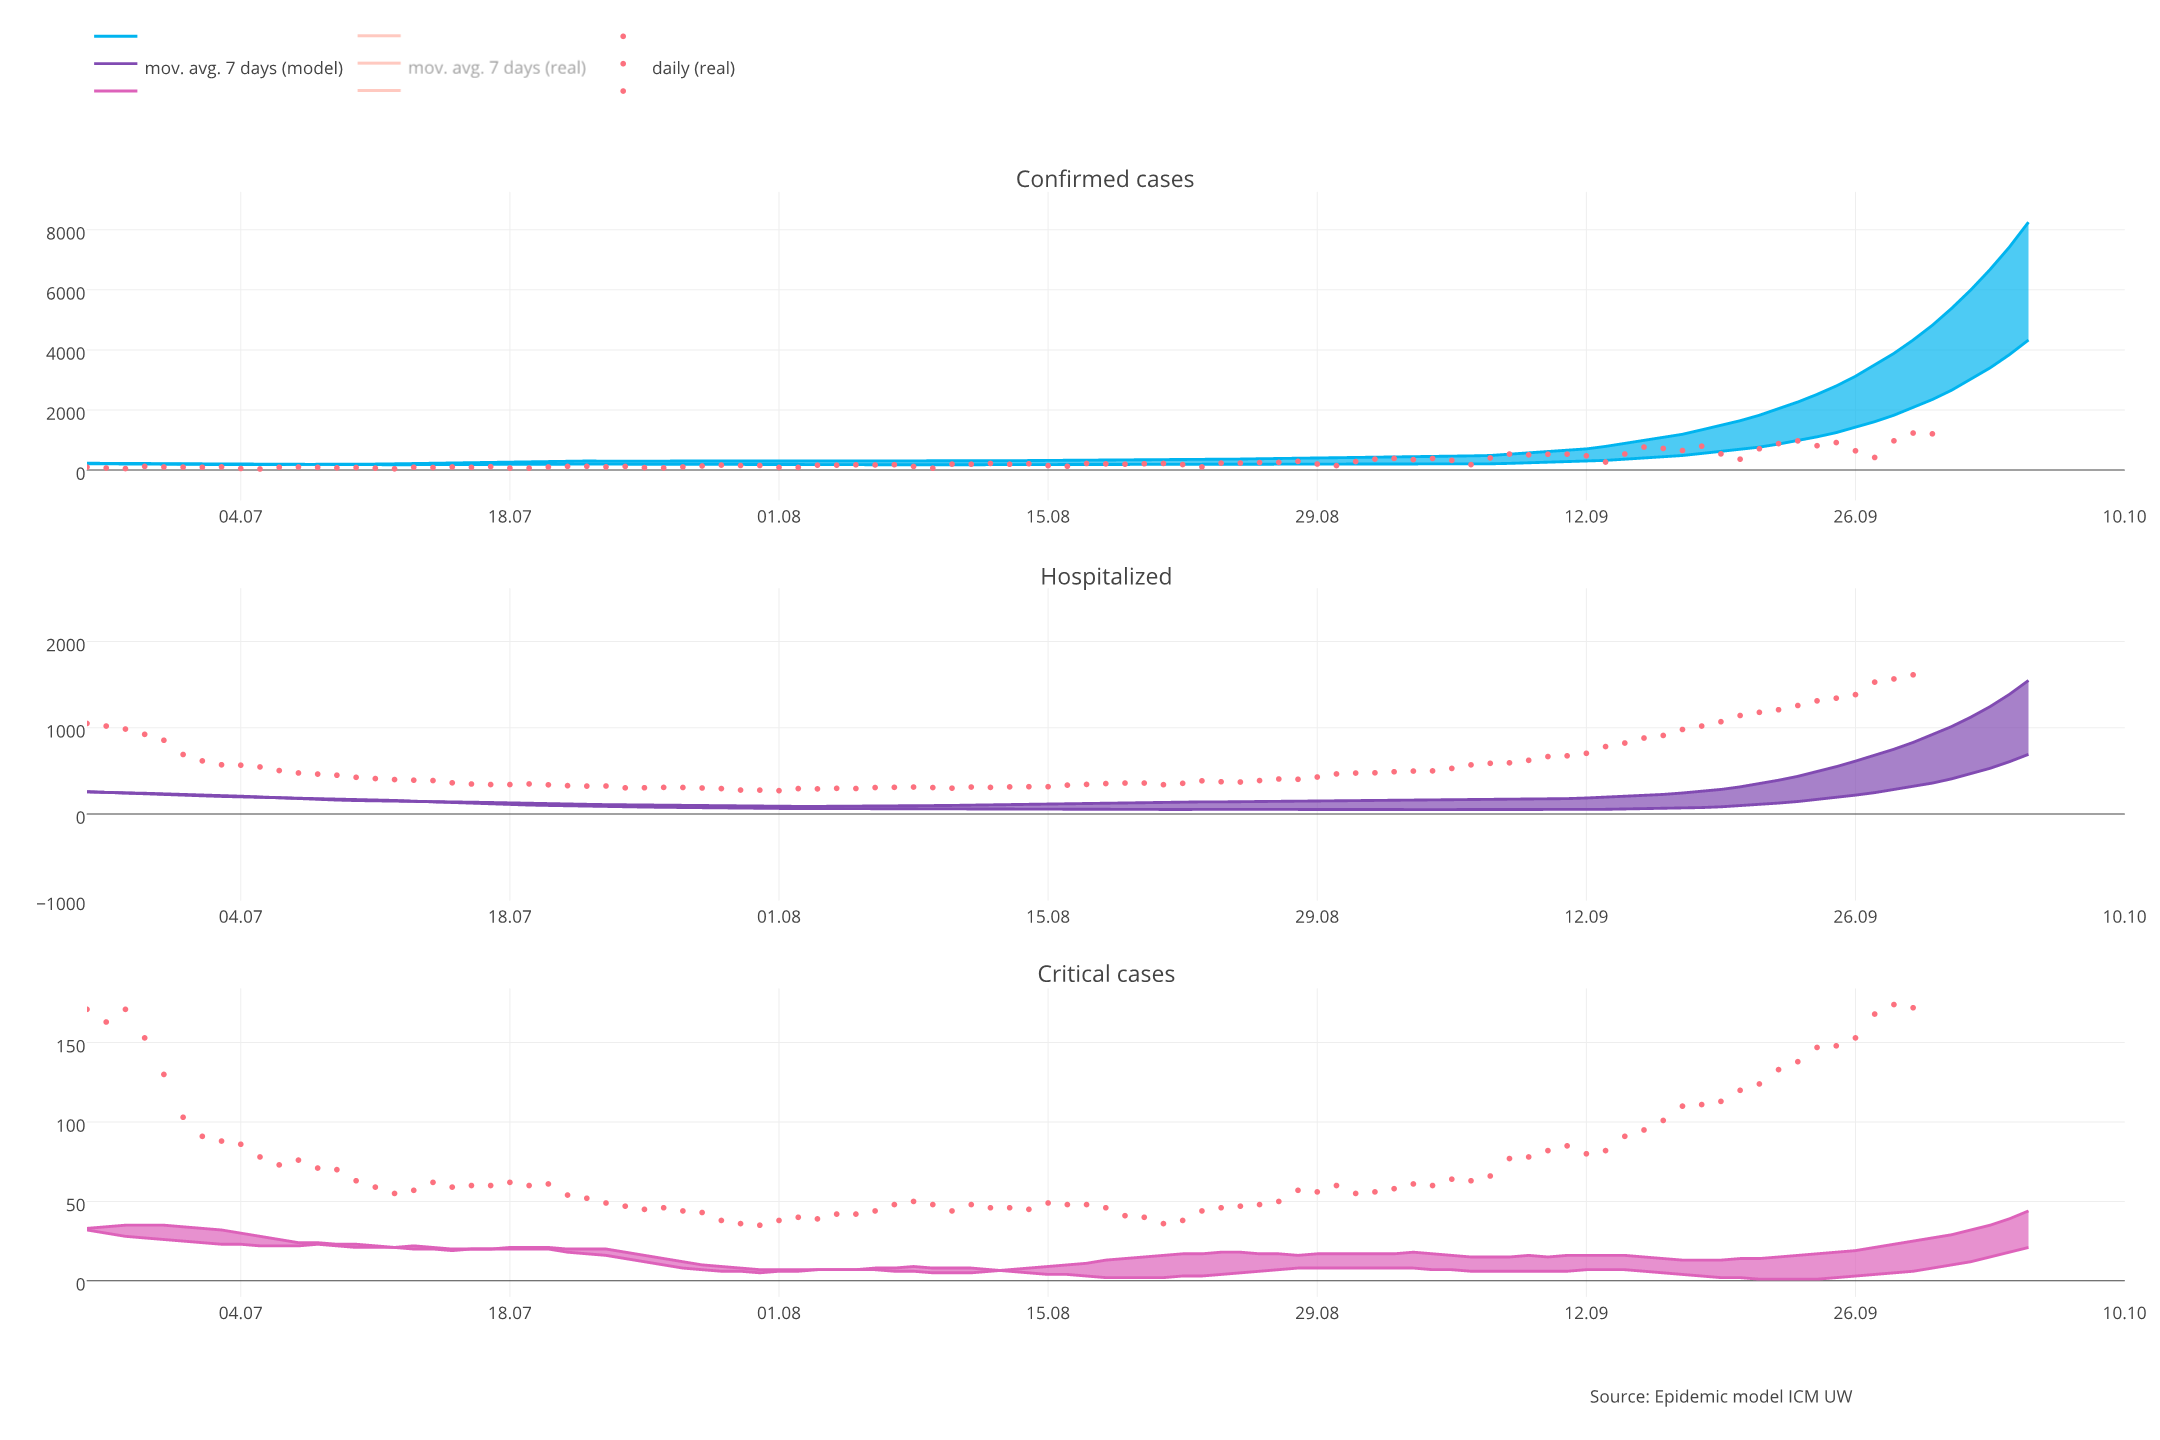
Dynamic chart of identified cases of Covid-19 infection in the period from March 16, 2020 with a prediction to August 31, 2022.
Chart prepared on the basis of the forecast of June 20, 2022.
The current forecast takes into account all historically introduced restrictions and easing, partly the increase in mobility and contact related to the influx of refugees, the seasonal effect, the impact of holidays and declining resilience. The forecast takes into account the BA2 sub-variant of the omicron variant, which is responsible for the majority of infections in Poland.
The scenarios for the development of the epidemic are presented assuming the population resistance of approximately 60% of survivors as of January 1, 2022.
Numbers of identified cases (data reported by Ministry of Health) from February 8, 2022 are given together with reinfections. The daily number of hospitalizations is not reported from April 1, 2022, from April 12, it is reported every week. Numbers of occupied ICU beds are not reported from April 1, 2022.
Approximately 22 million people who received at least one dose of the vaccine and 10 million who received a booster dose were vaccinated. Data updated on January 25, 2022.
Download full resolution chart
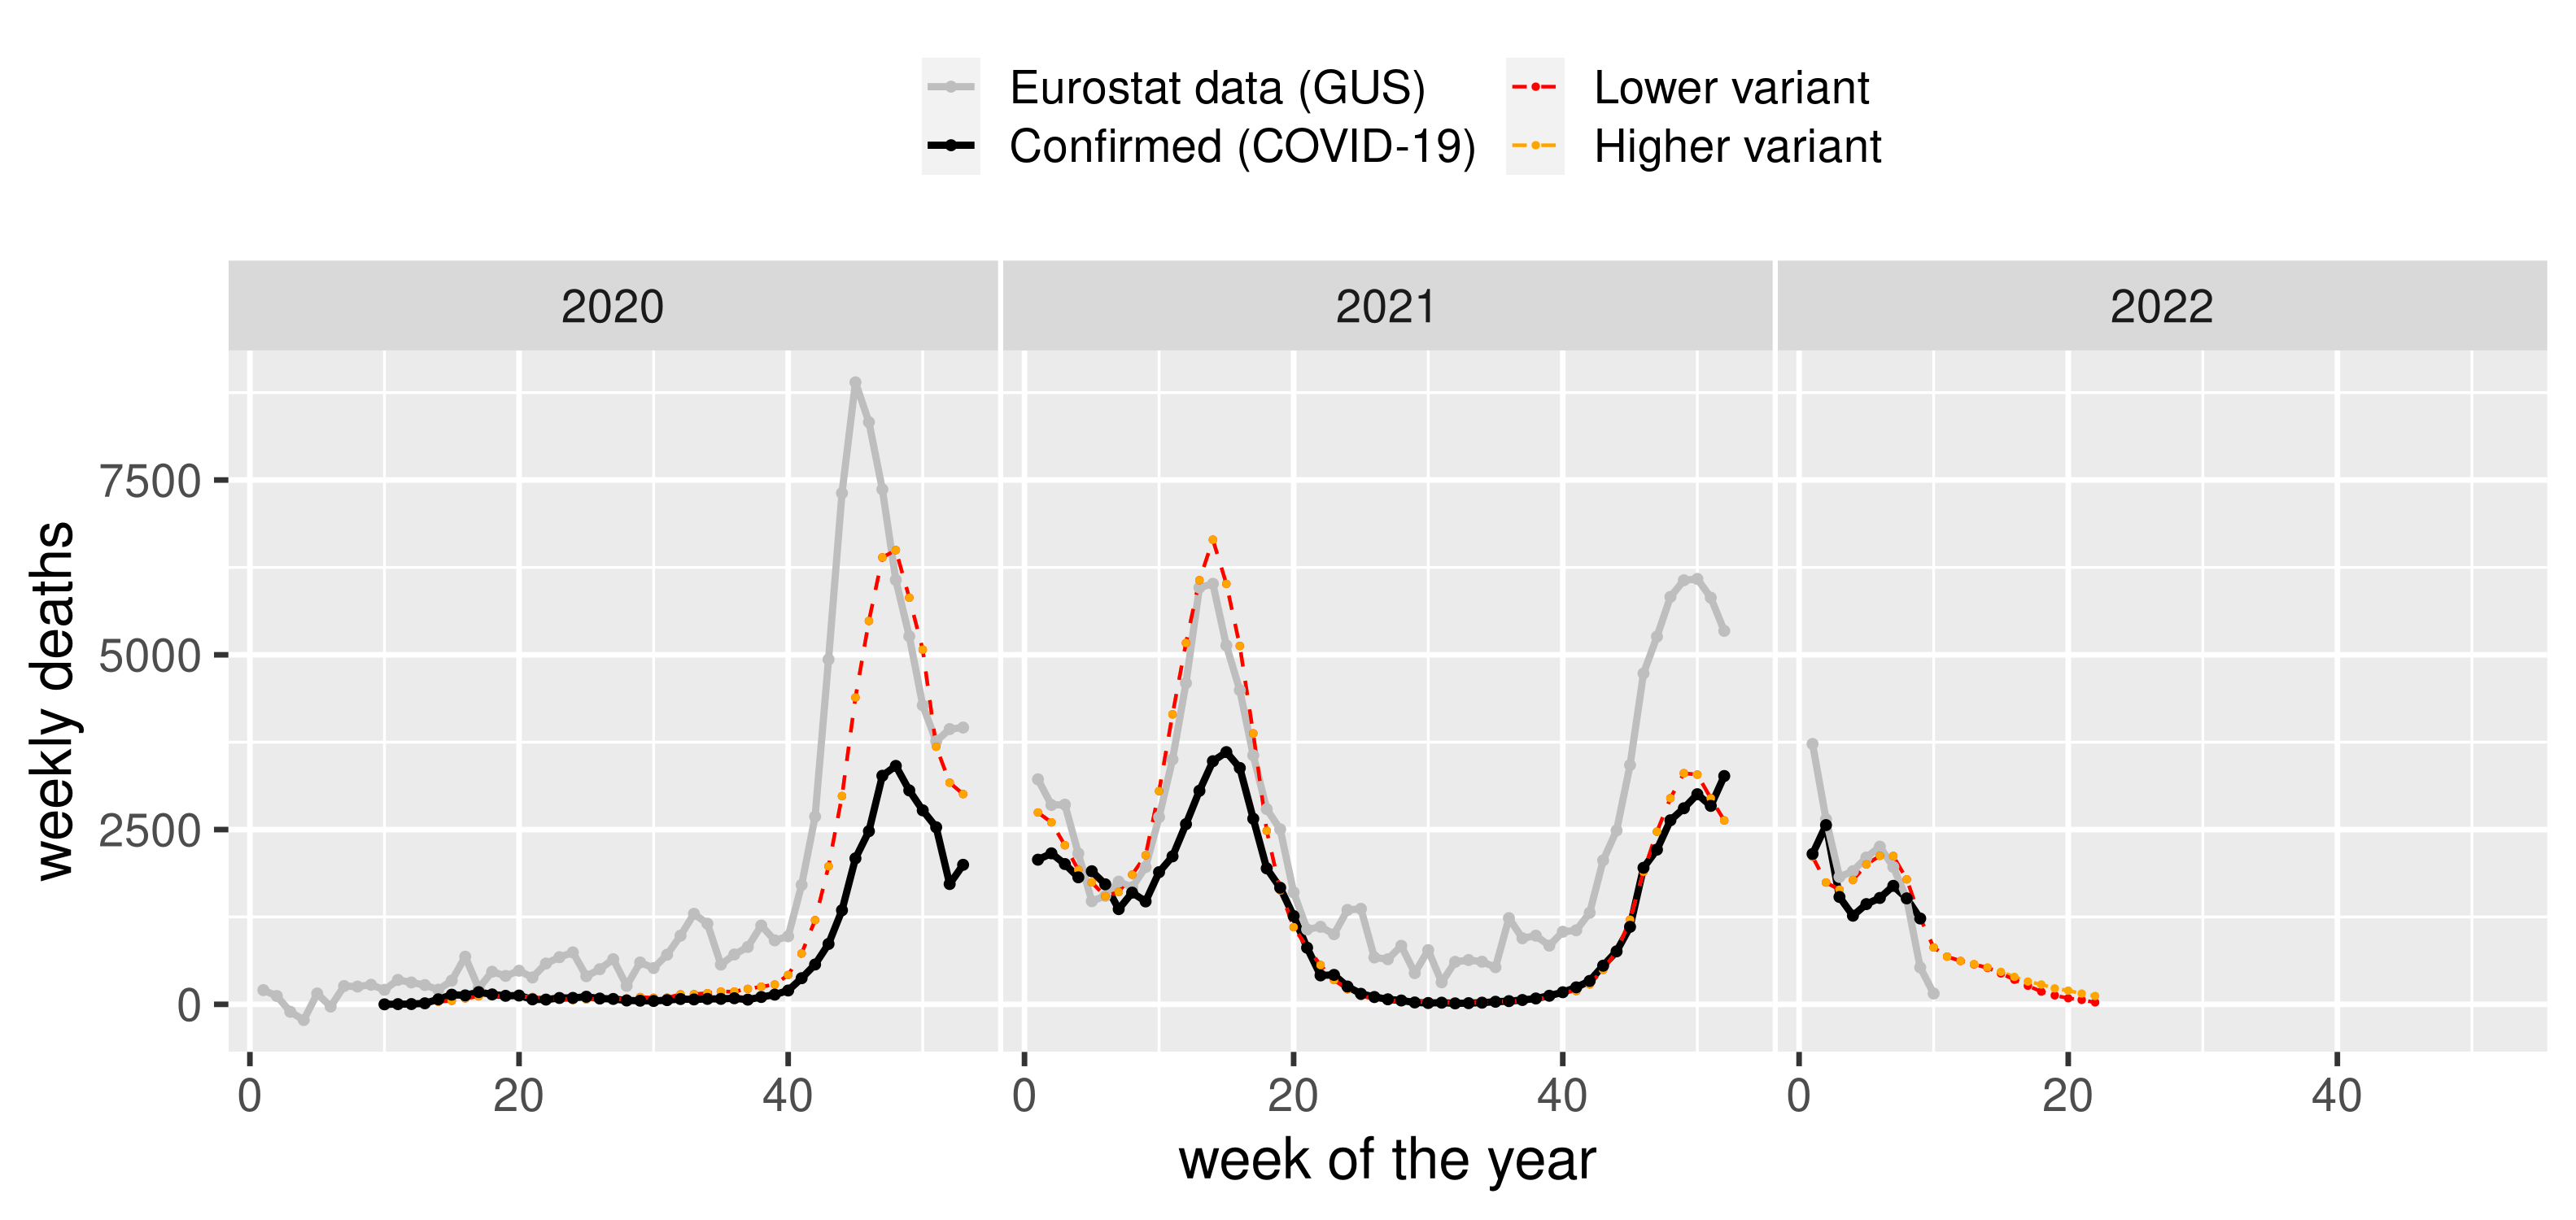
Excessive number of deaths
The plot below shows weekly deaths in our model, confirmed COVID-19 deaths and excessive number of deaths based on Eurostat (GUS) data (avg. weekly deaths 2010-2019 substracted from weekly deaths 2020 and 2021).
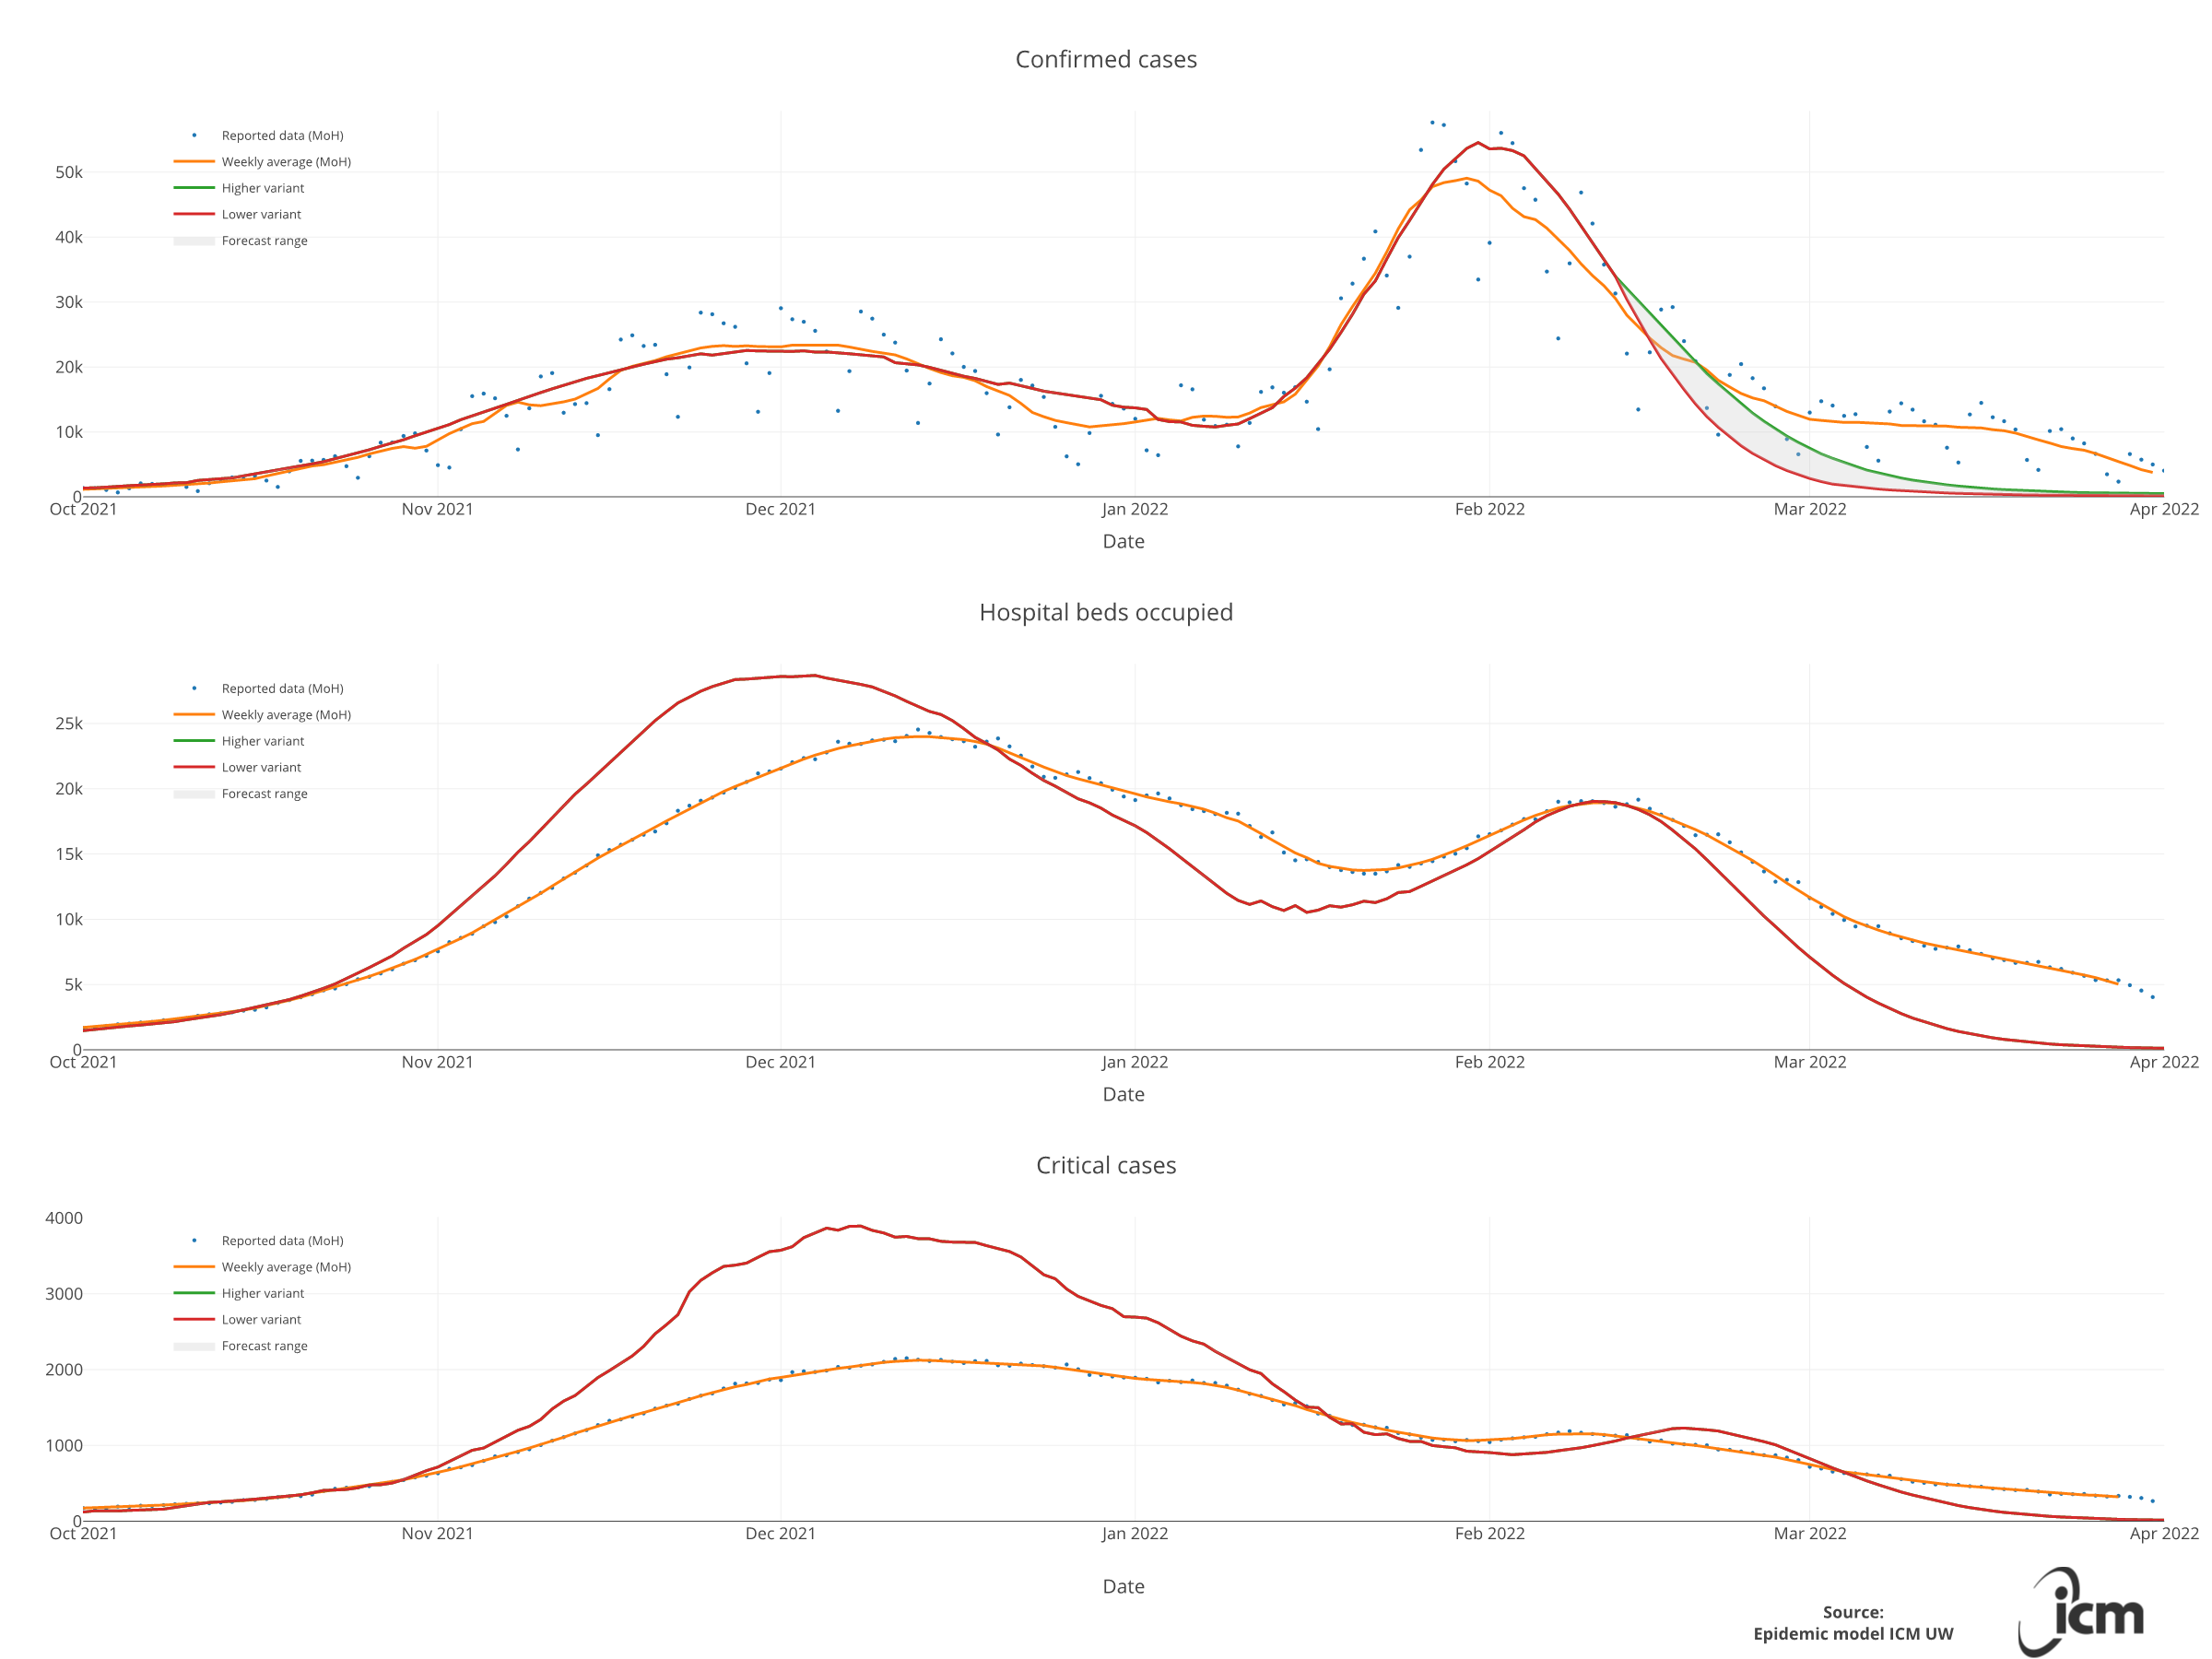
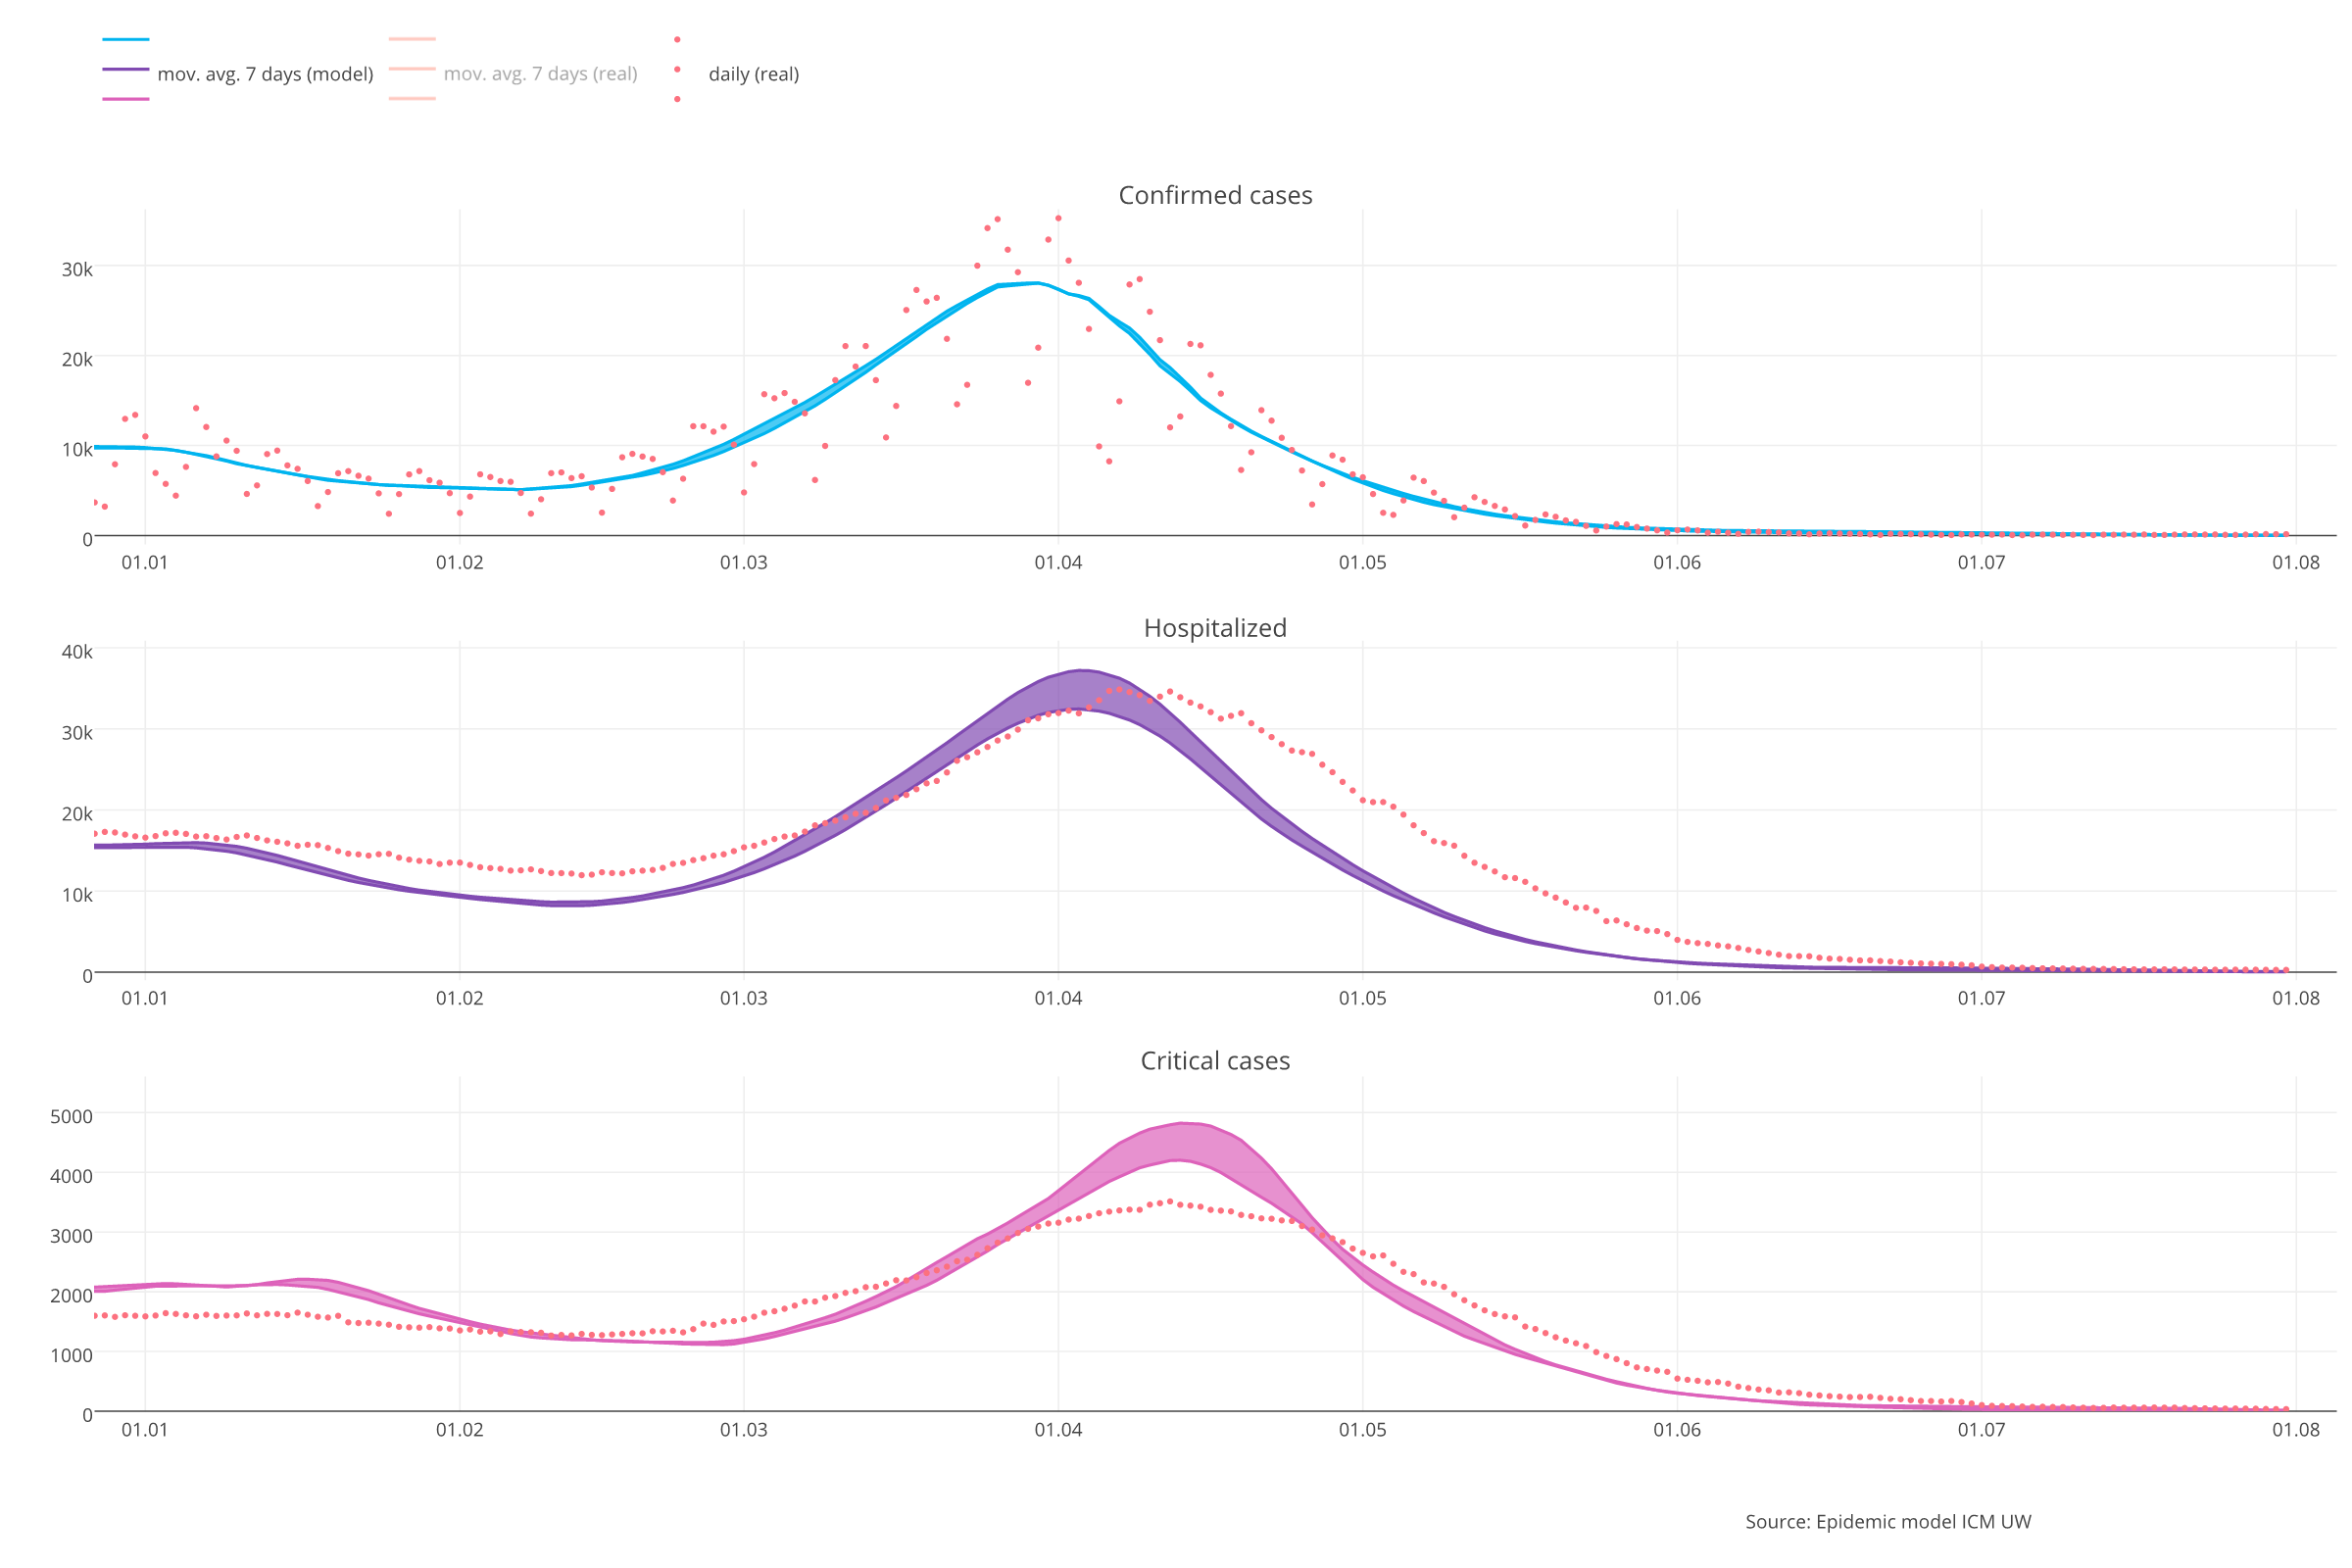
Dynamic chart of identified cases of Covid-19 infection in the period from March 16, 2020 with a prediction to March 31, 2022.
Chart prepared on the basis of the forecast of February 11, 2022.
The current forecast takes into account all historically introduced restrictions and easings, increasing the intensity of social contacts before Christmas, closure of schools on December 20, winter holidays and opening schools according to schedule.
The epidemic spreading scenarios are presented with the assumption of population immunity of about 43% of recoveries on September 10/2021.
Numbers of identified cases (reported data MoH) from February 8, 2022 are given together with reinfections.
Approximately 22 million people who received at least one dose of the vaccine and 10 million who received a booster dose were vaccinated. Data updated on January 25, 2022.
Download full resolution chart
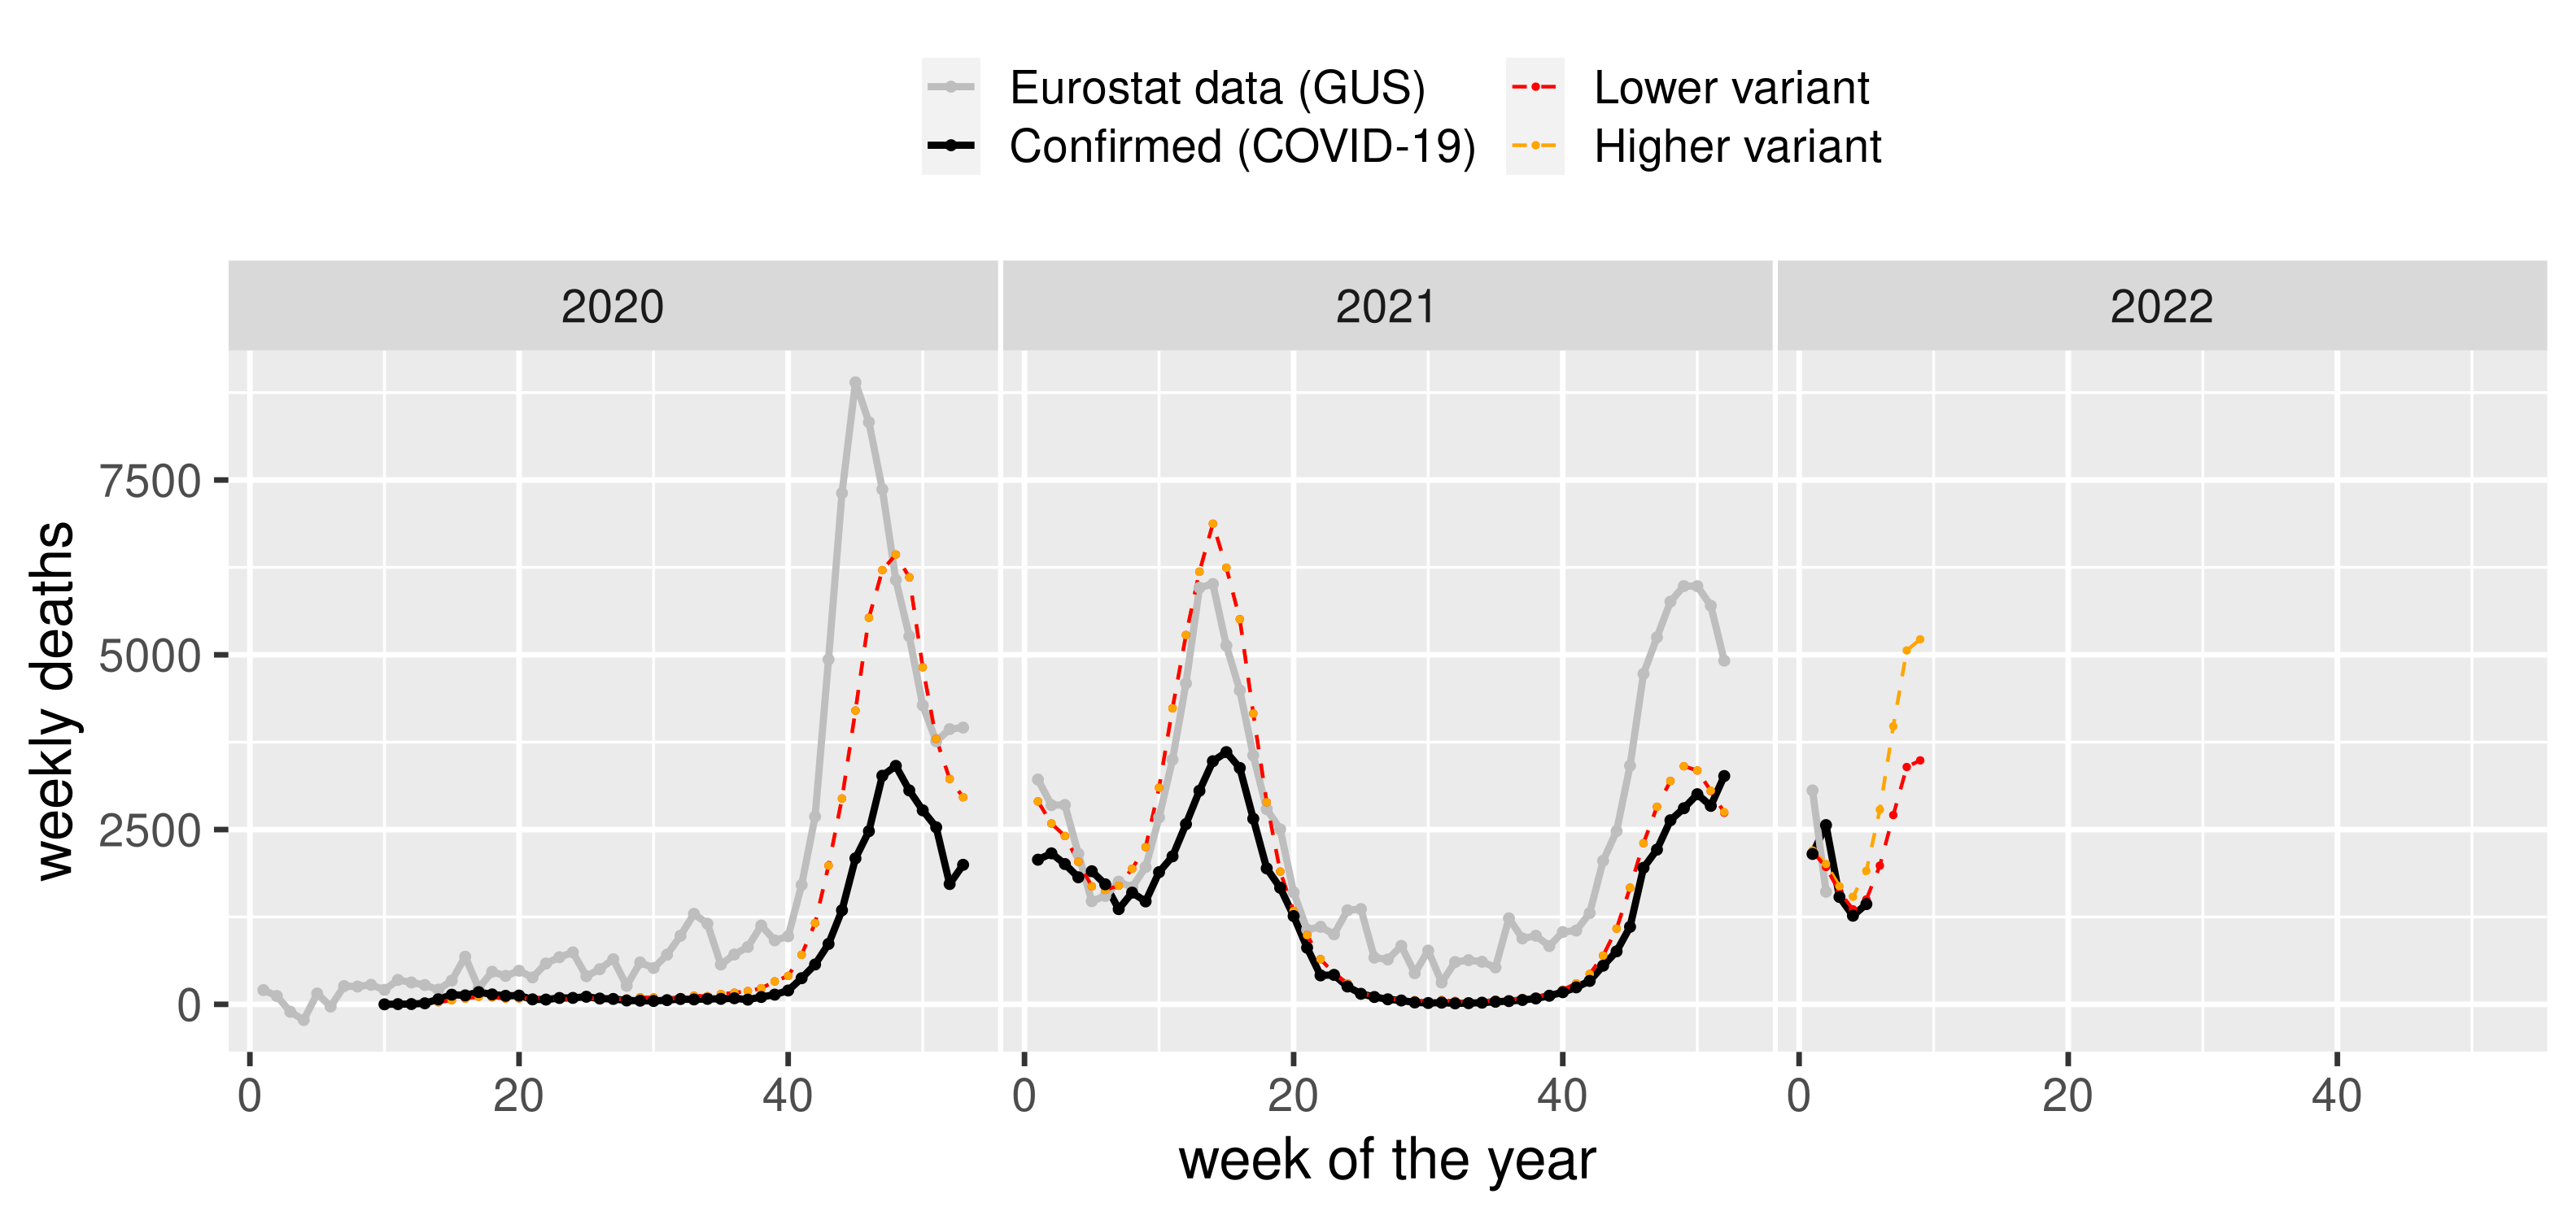
Excessive number of deaths
The plot below shows weekly deaths in our model, confirmed COVID-19 deaths and excessive number of deaths based on Eurostat (GUS) data (avg. weekly deaths 2010-2019 substracted from weekly deaths 2020 and 2021).
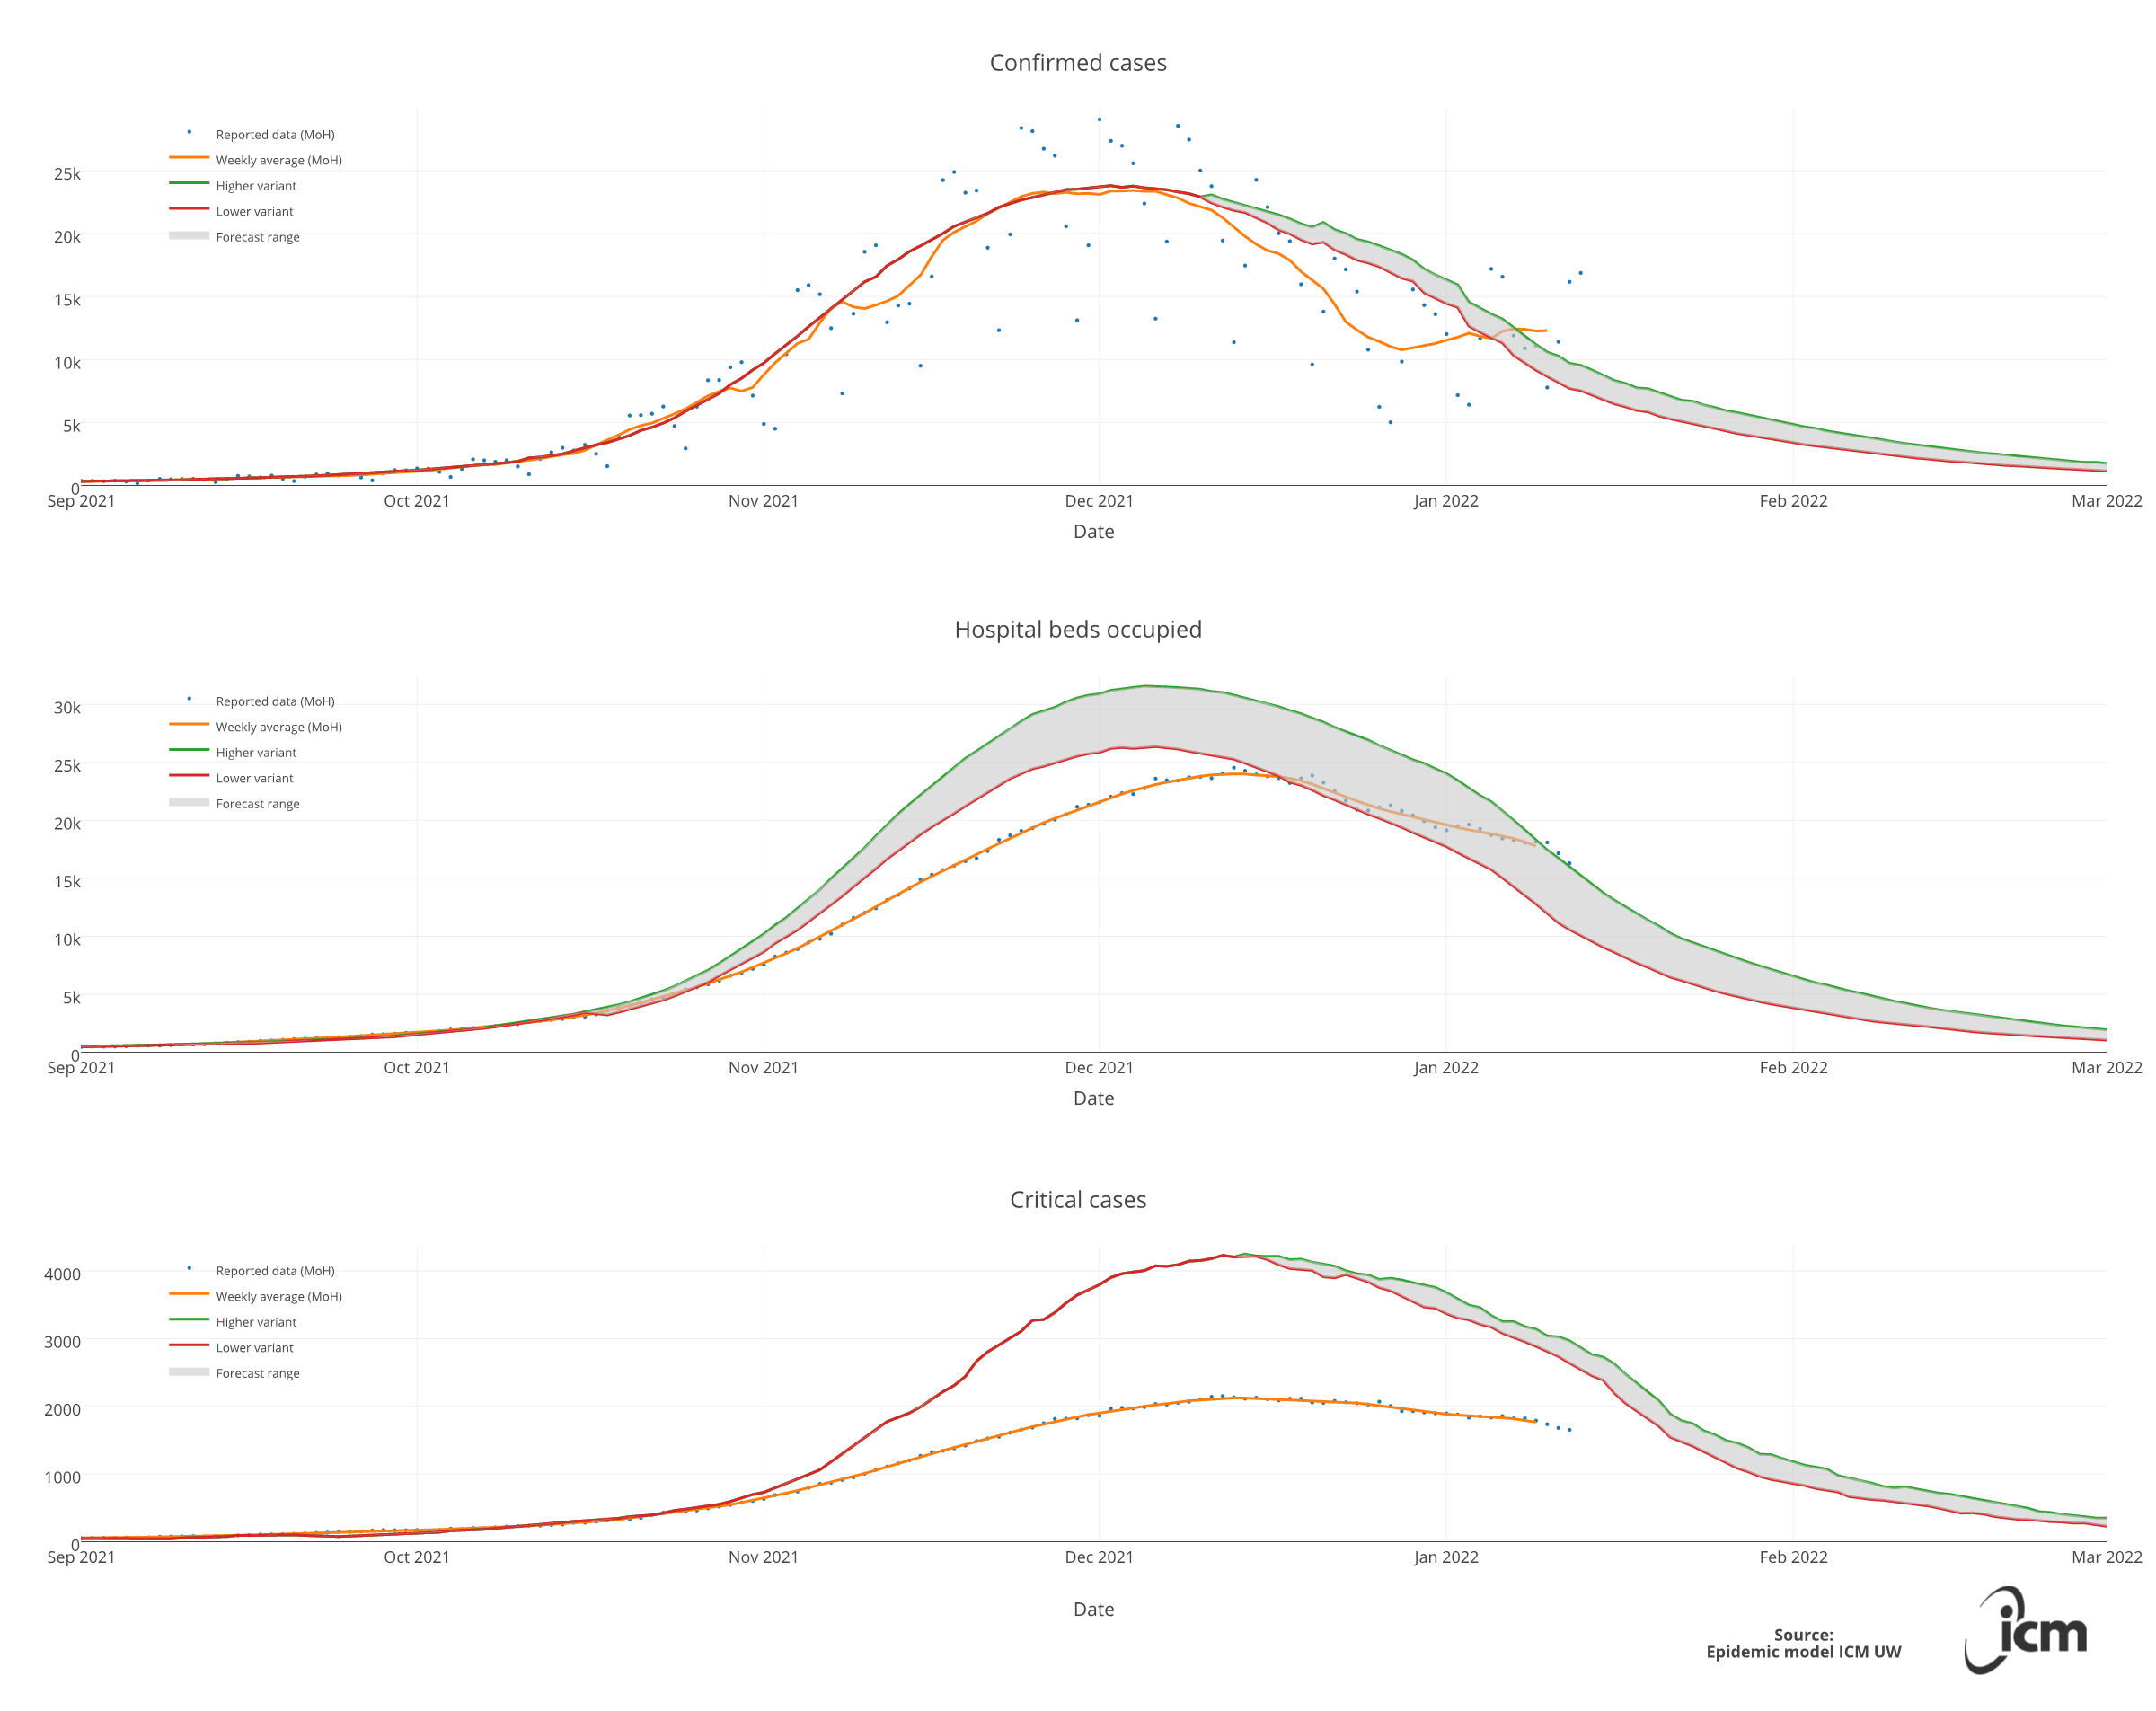
Dynamic chart of identified cases of Covid-19 infection in the period from March 16, 2020 with a prediction to March 1, 2022.
Chart prepared on the basis of the forecast of January 10, 2022.
The current forecast takes into account all historically introduced restrictions, the holiday period and the return to the social situation from September 2020 and then increasing the intensity of social contacts before Christmas and the closure of schools on December 20.
The epidemic spreading scenarios are presented with the assumption of population immunity of about 43% of recoveries on September 10/2021.
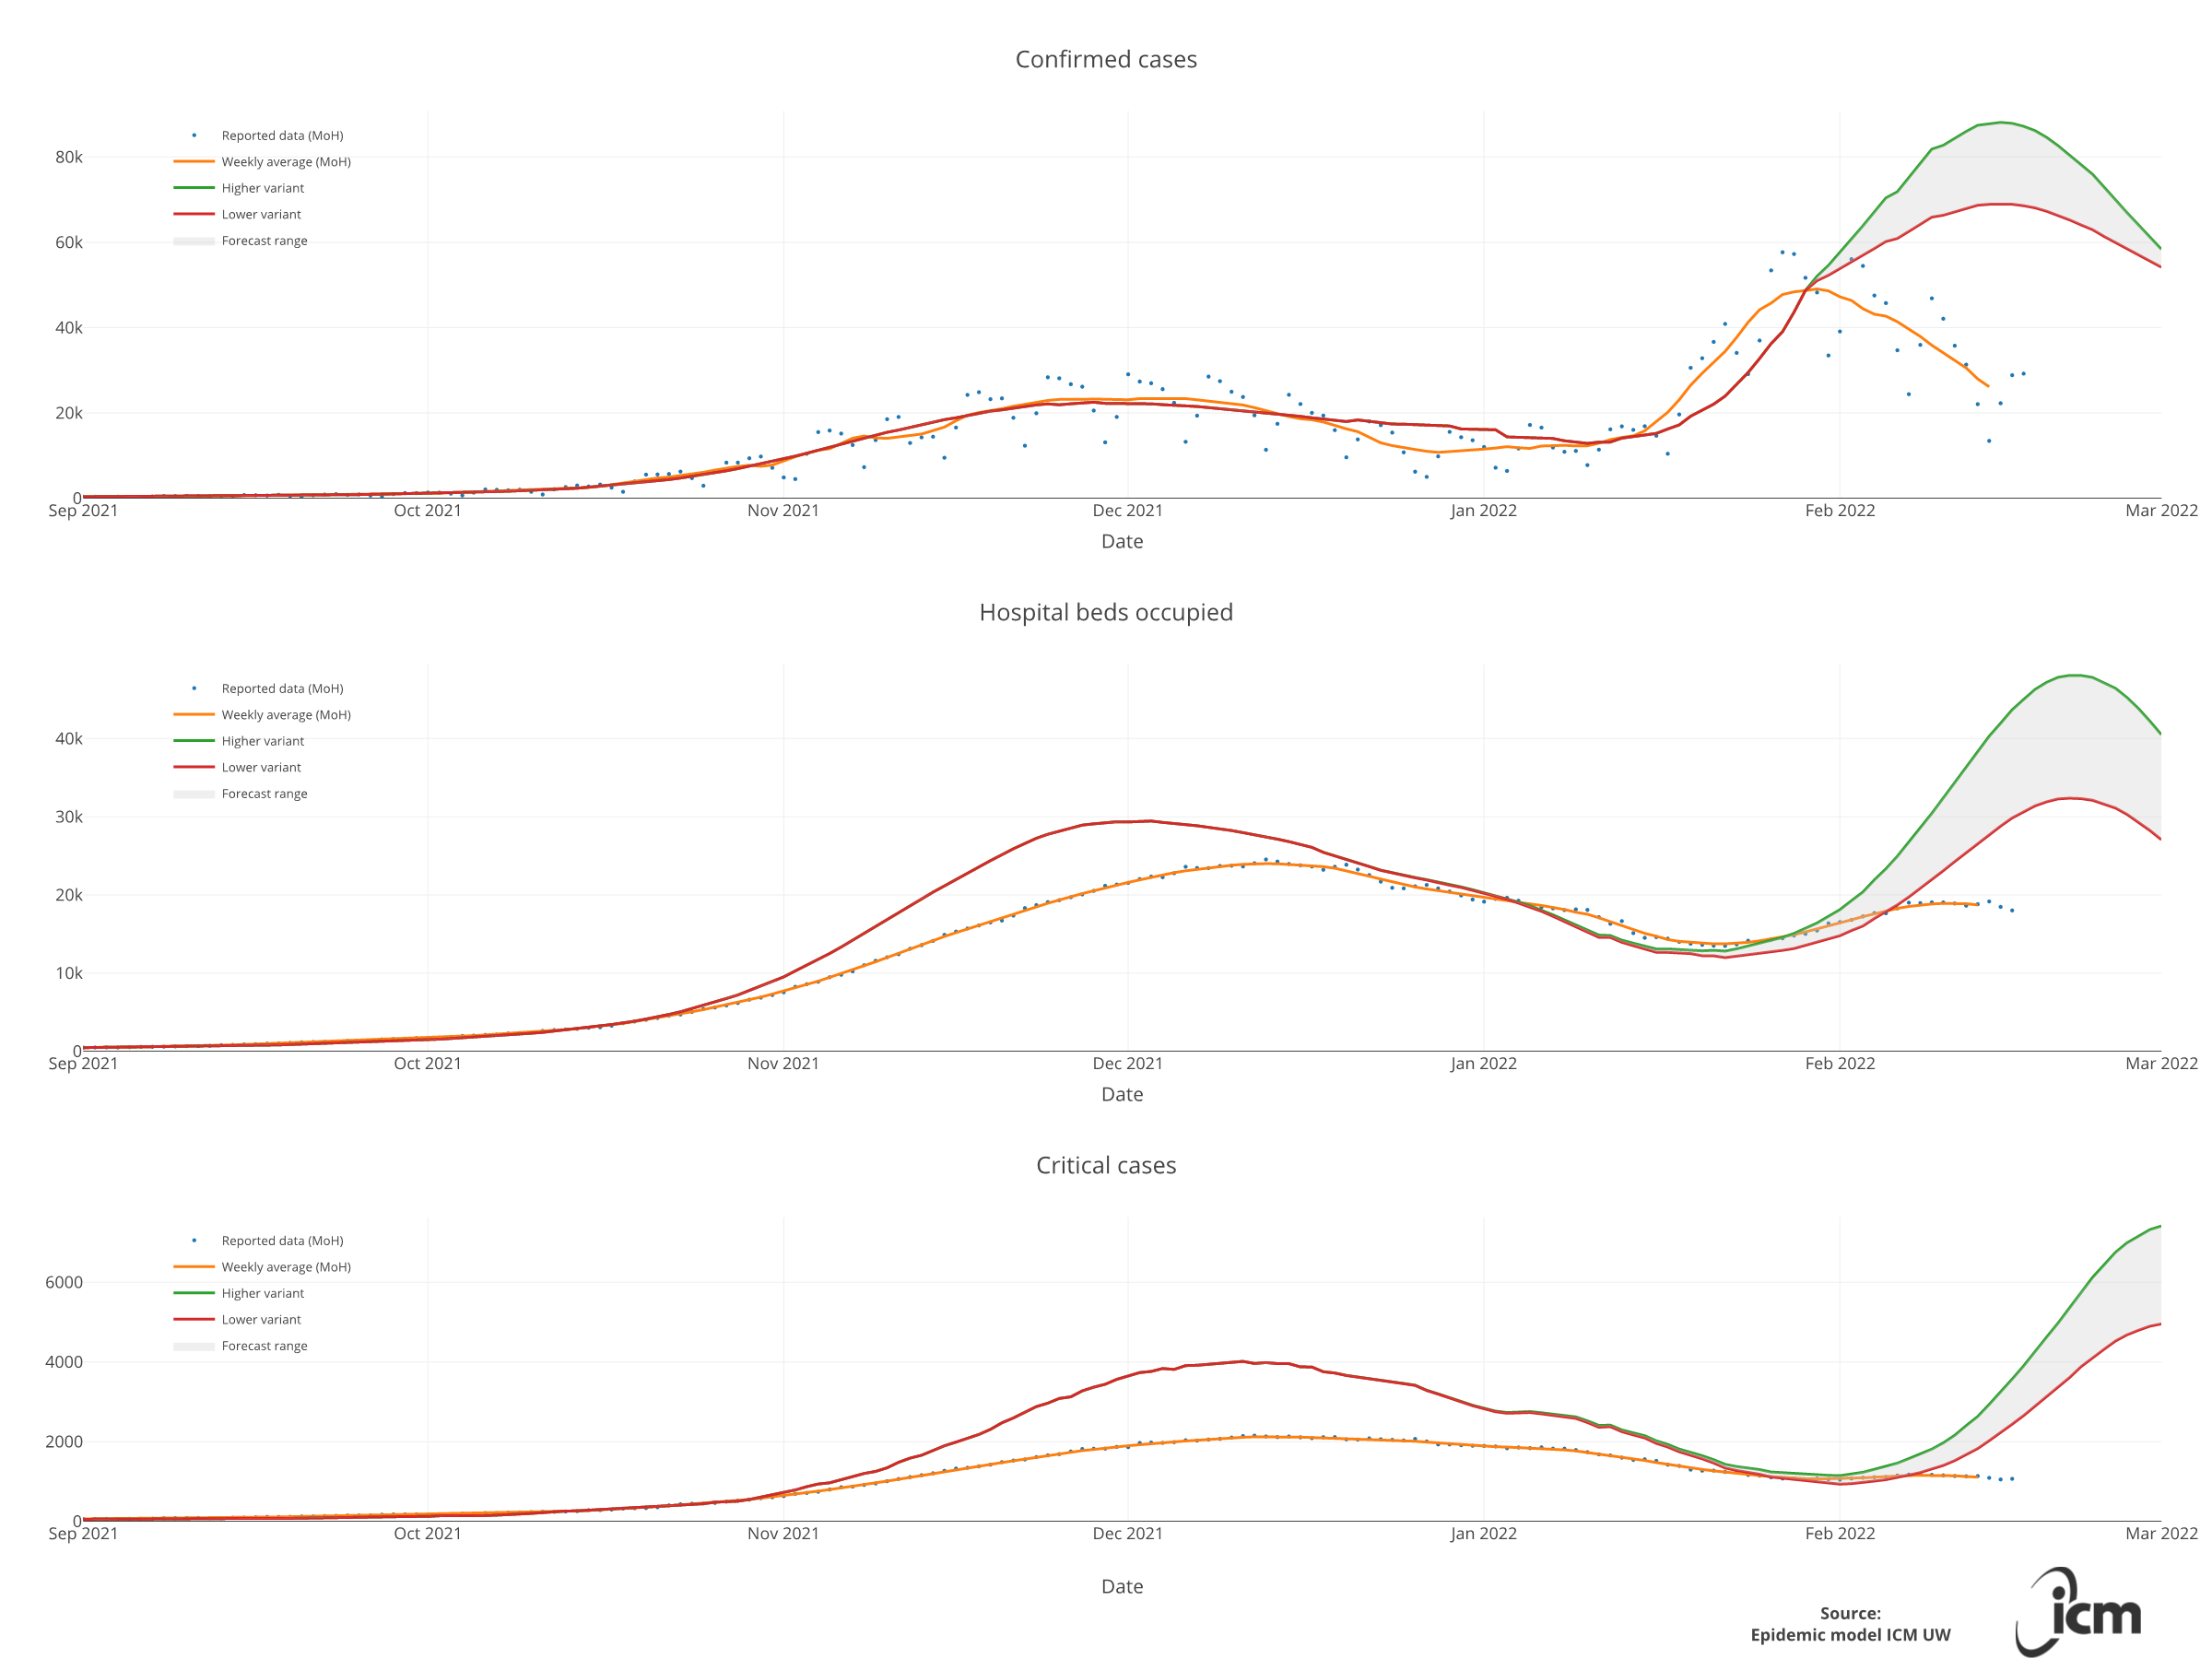
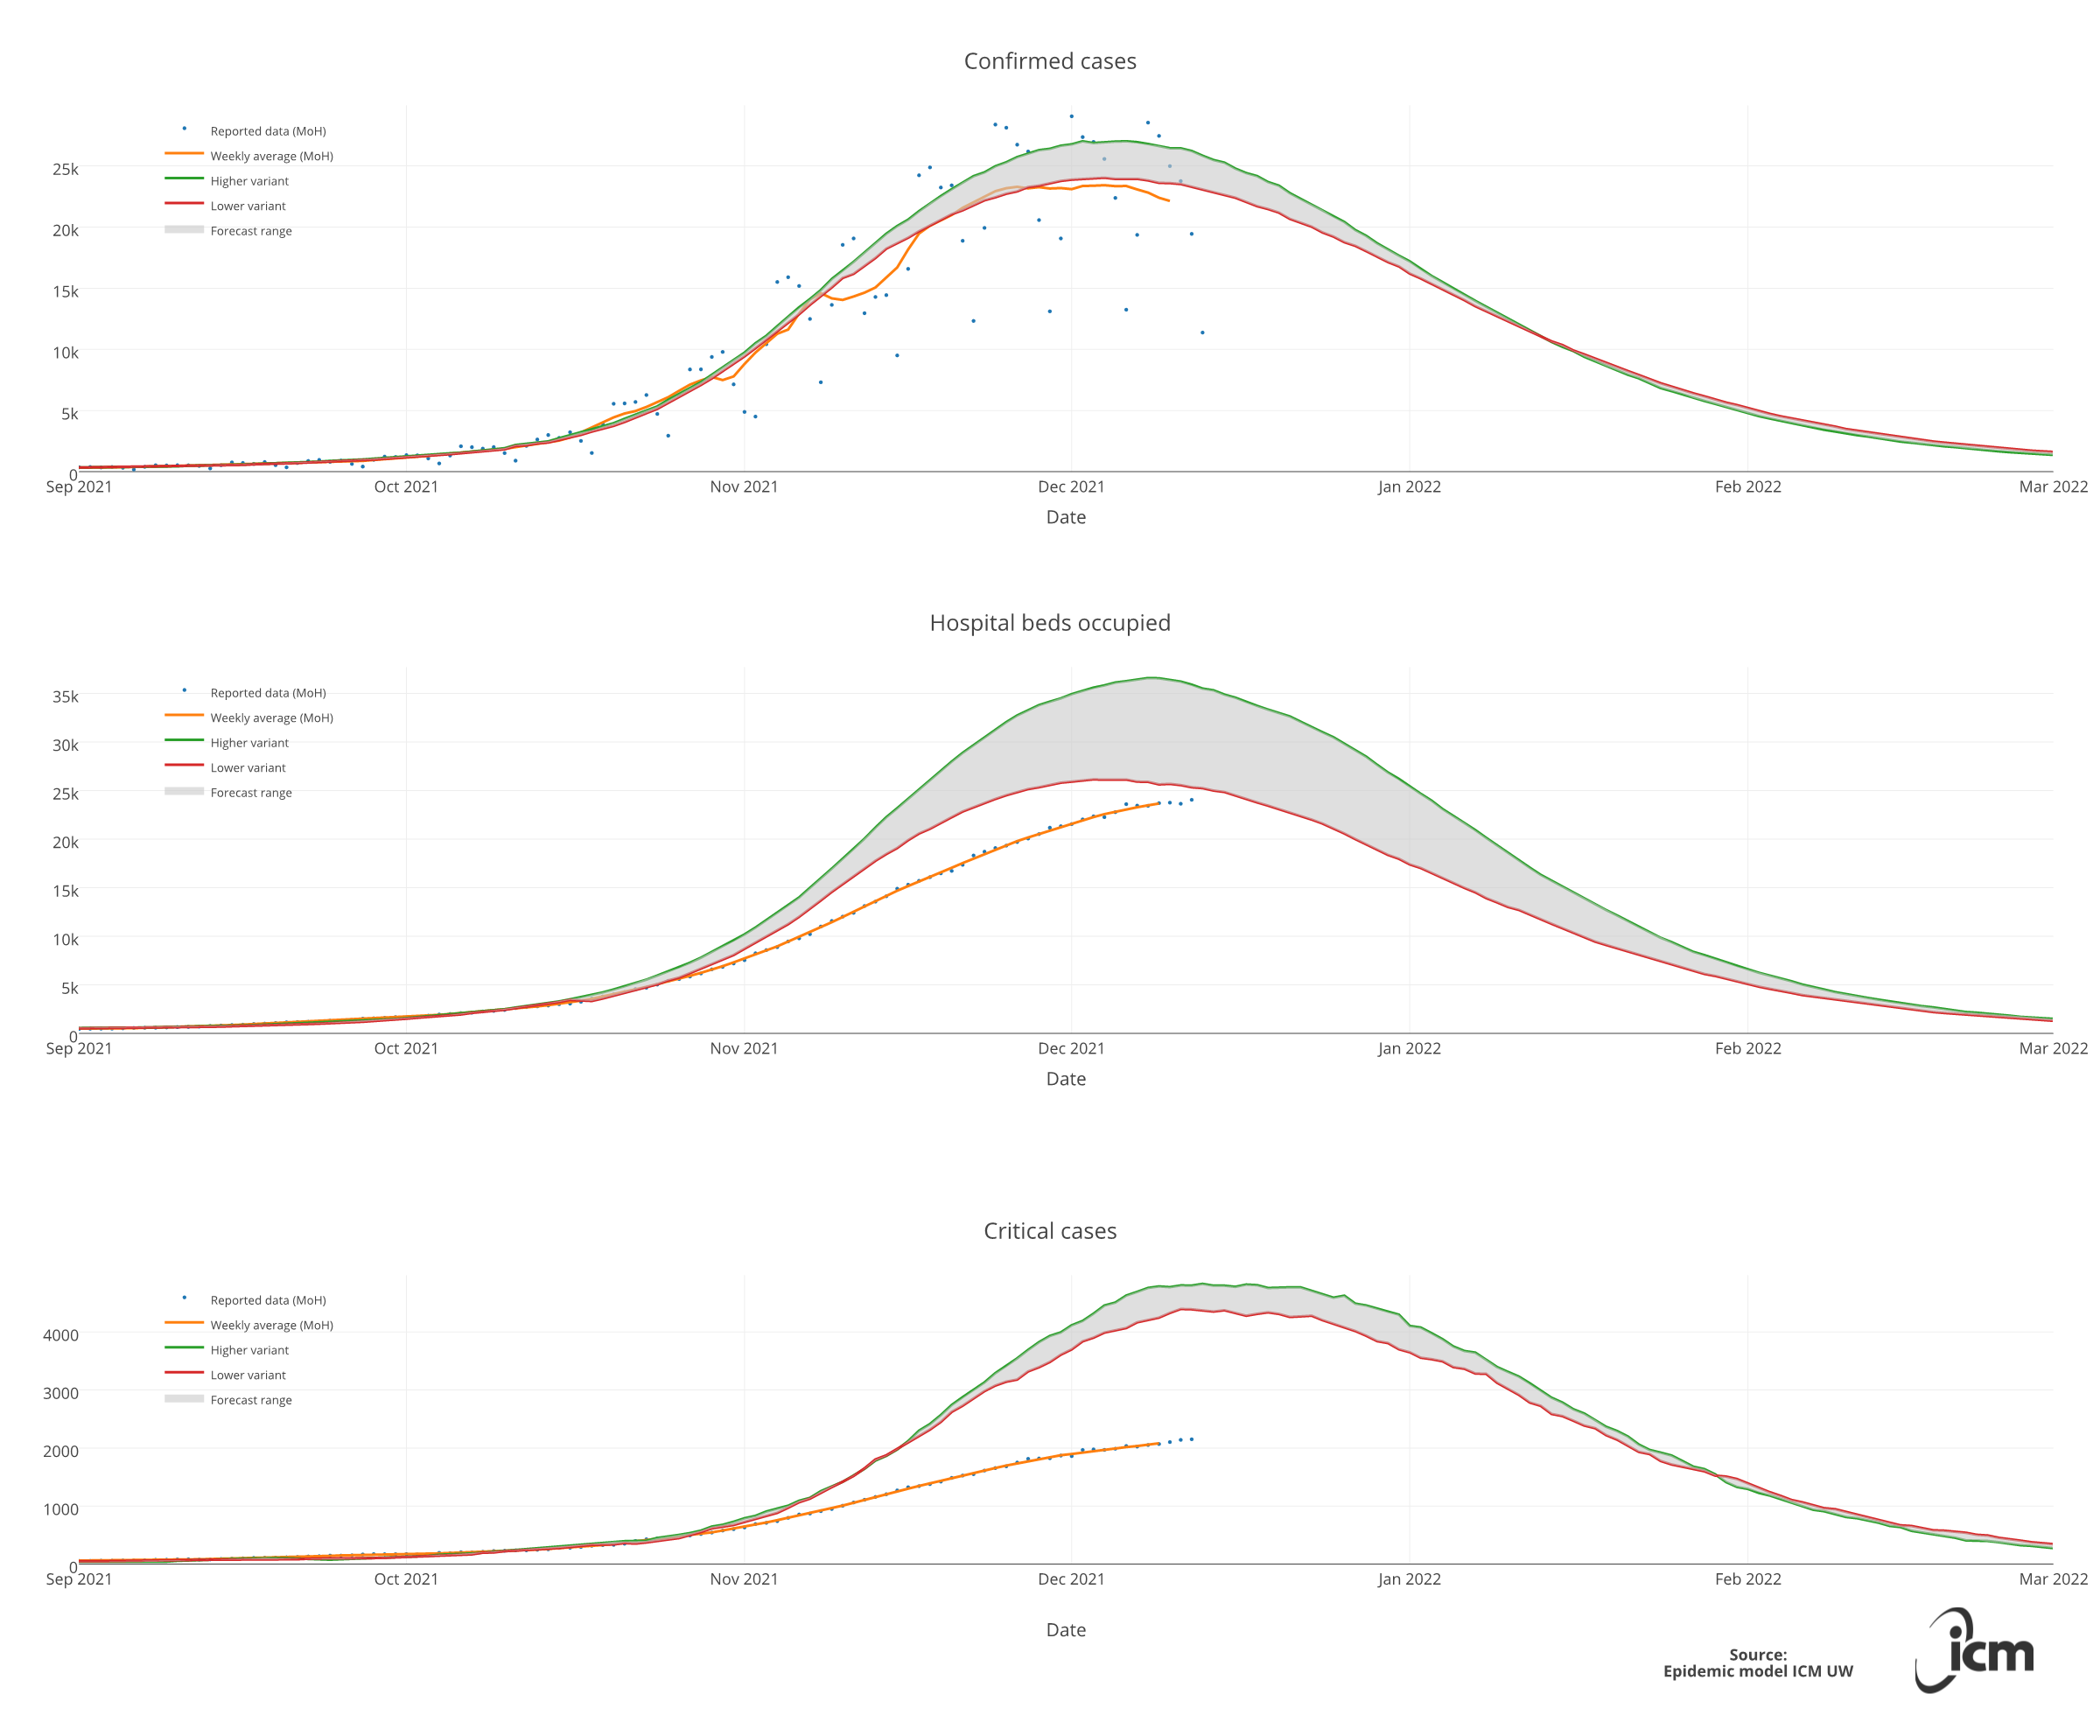
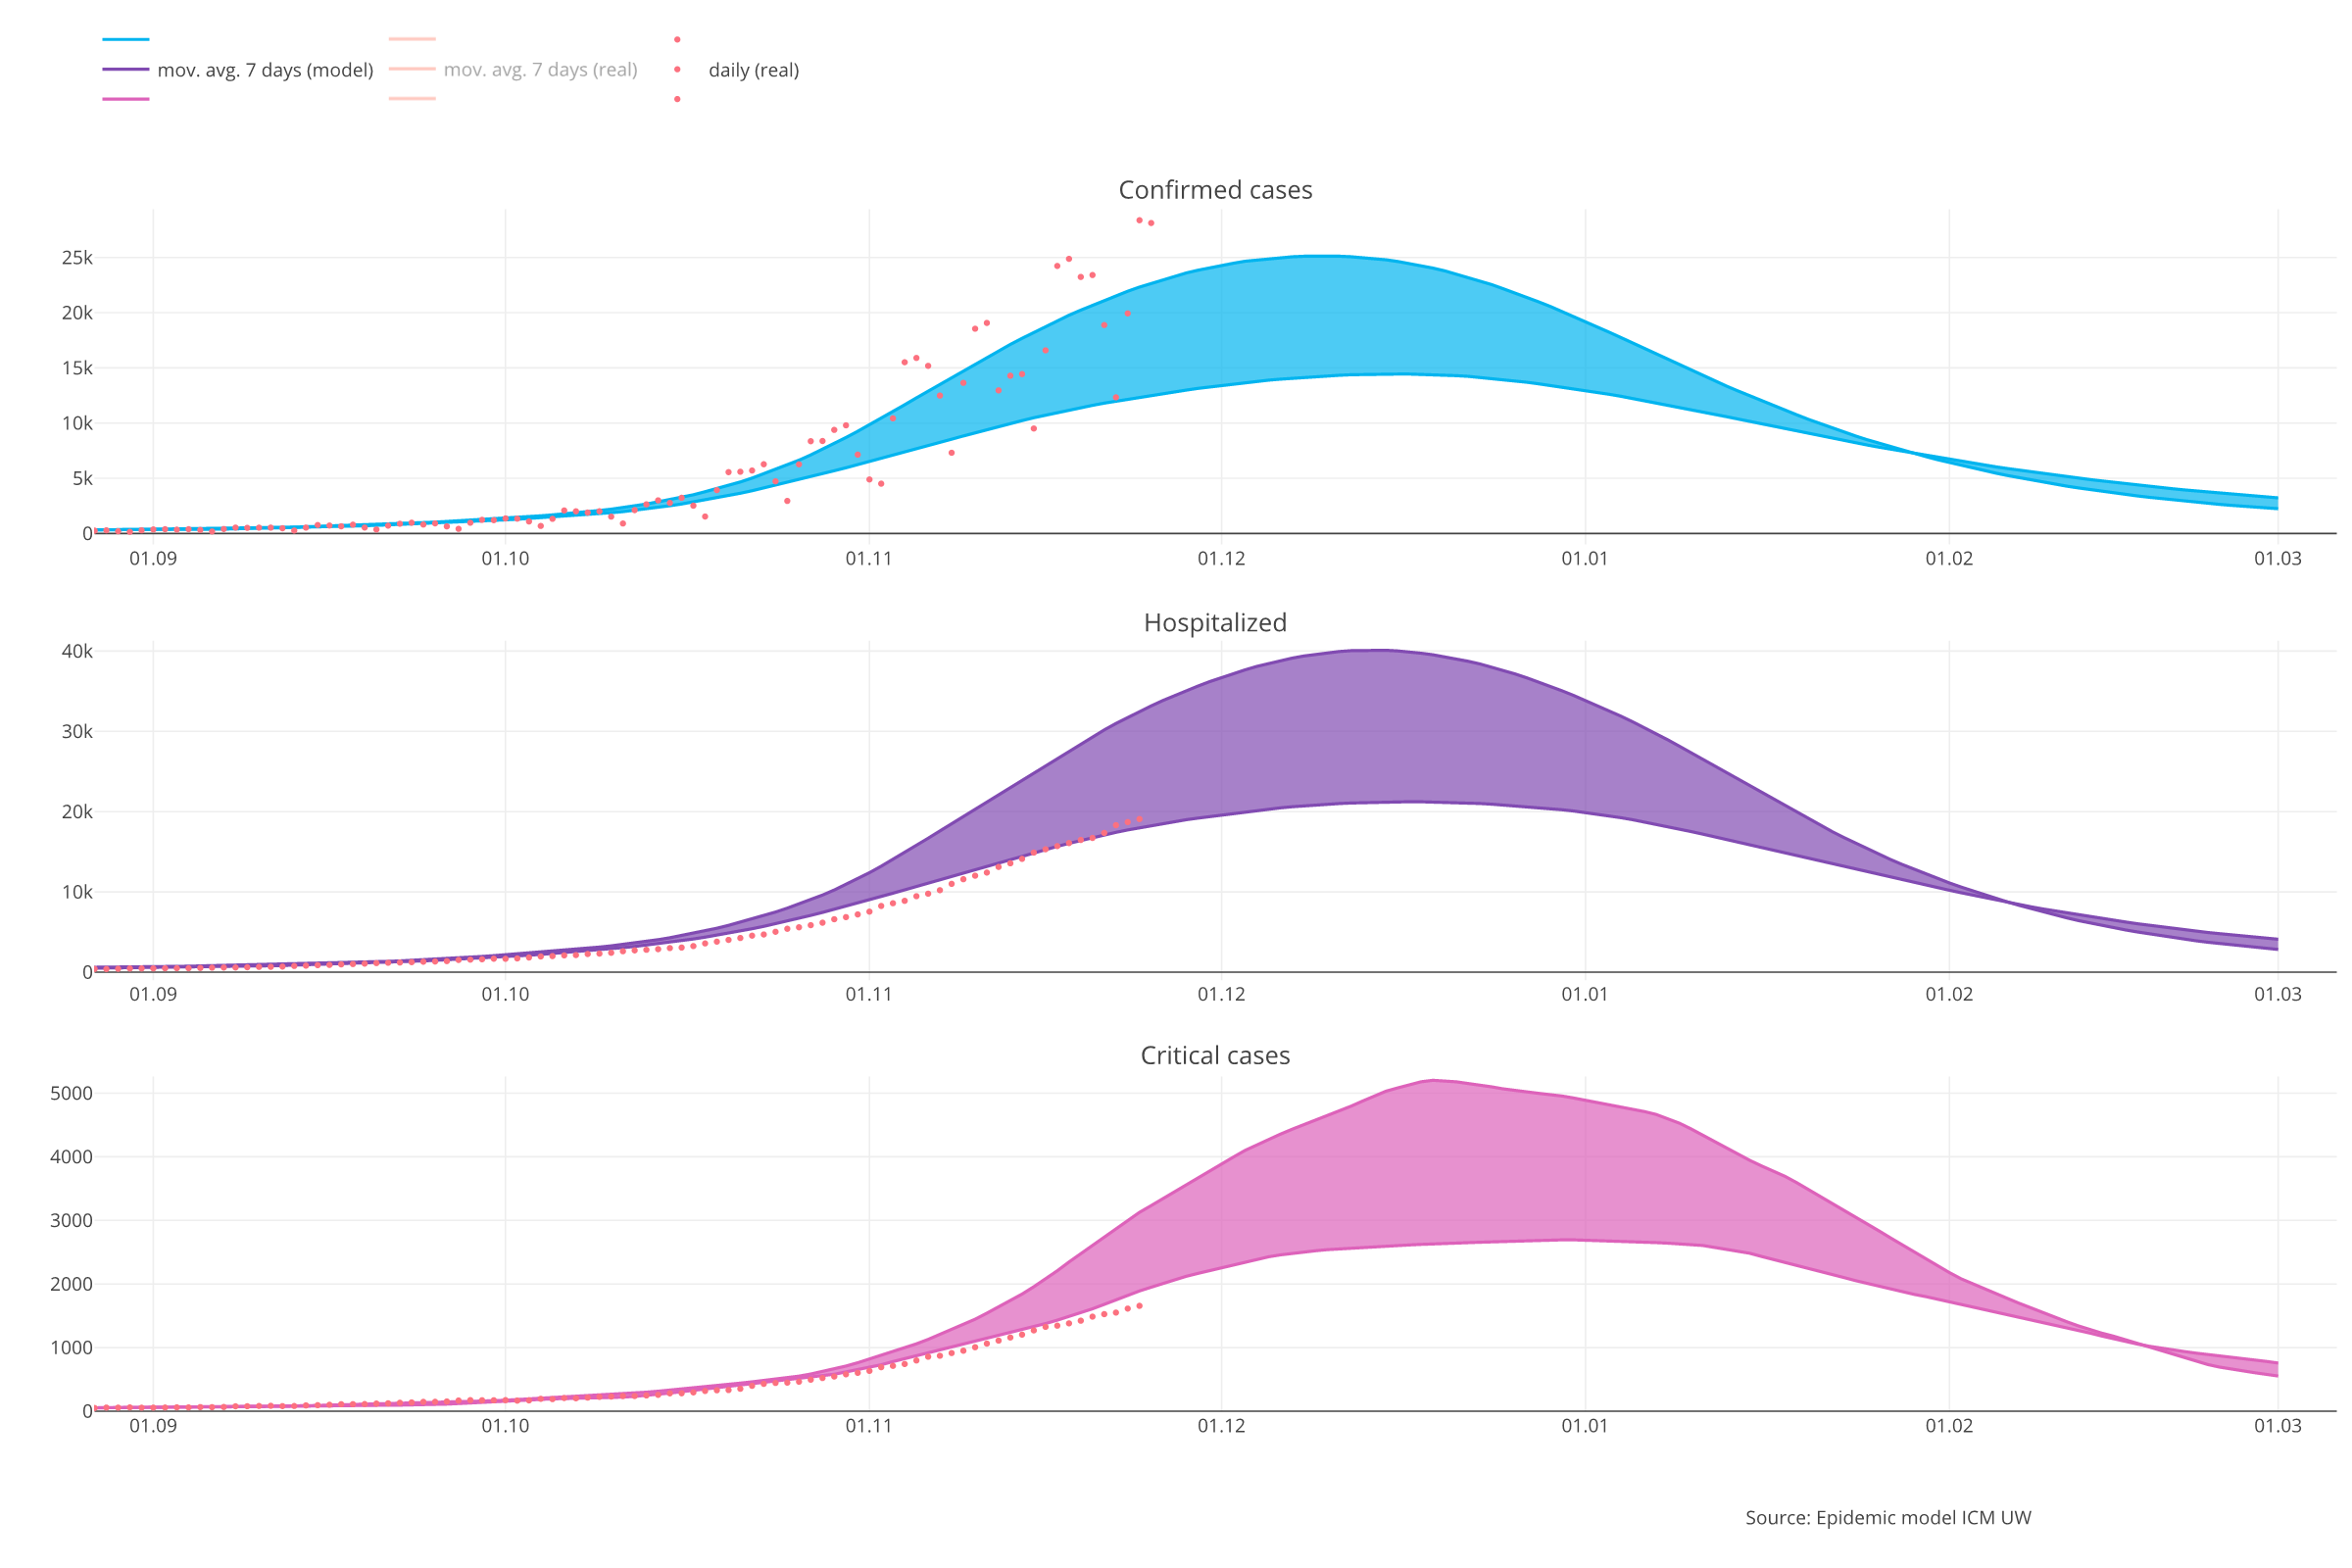
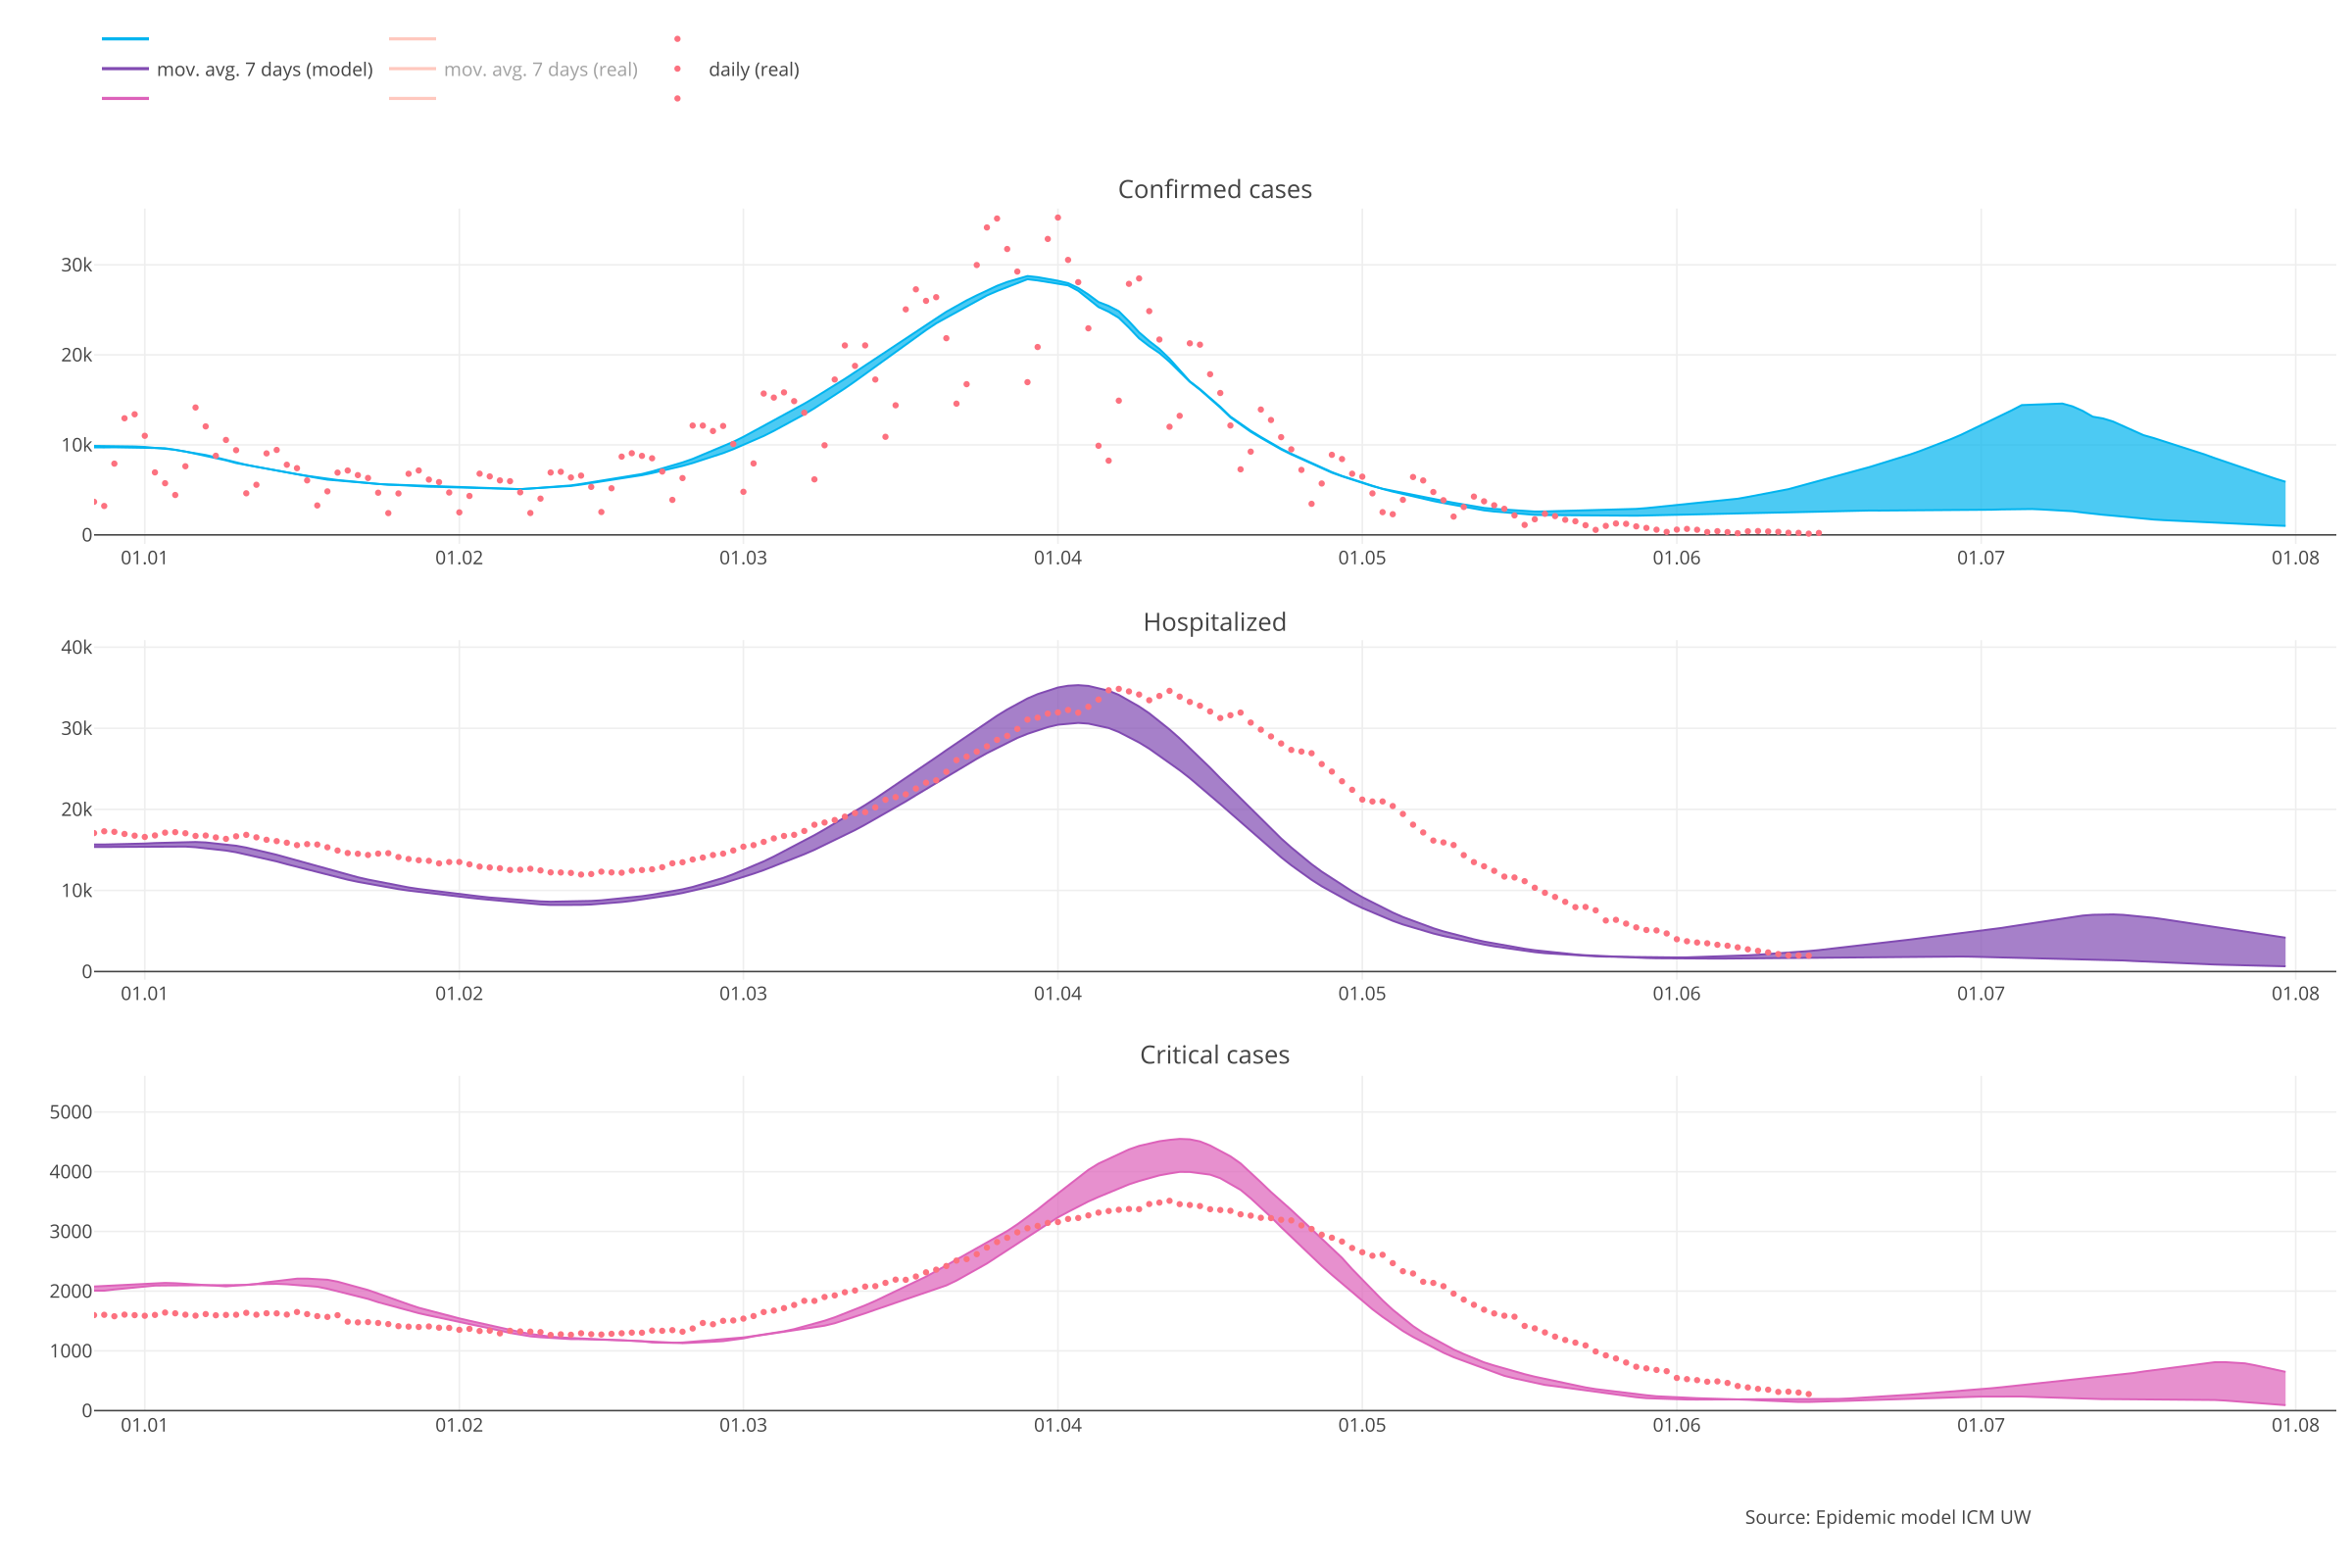
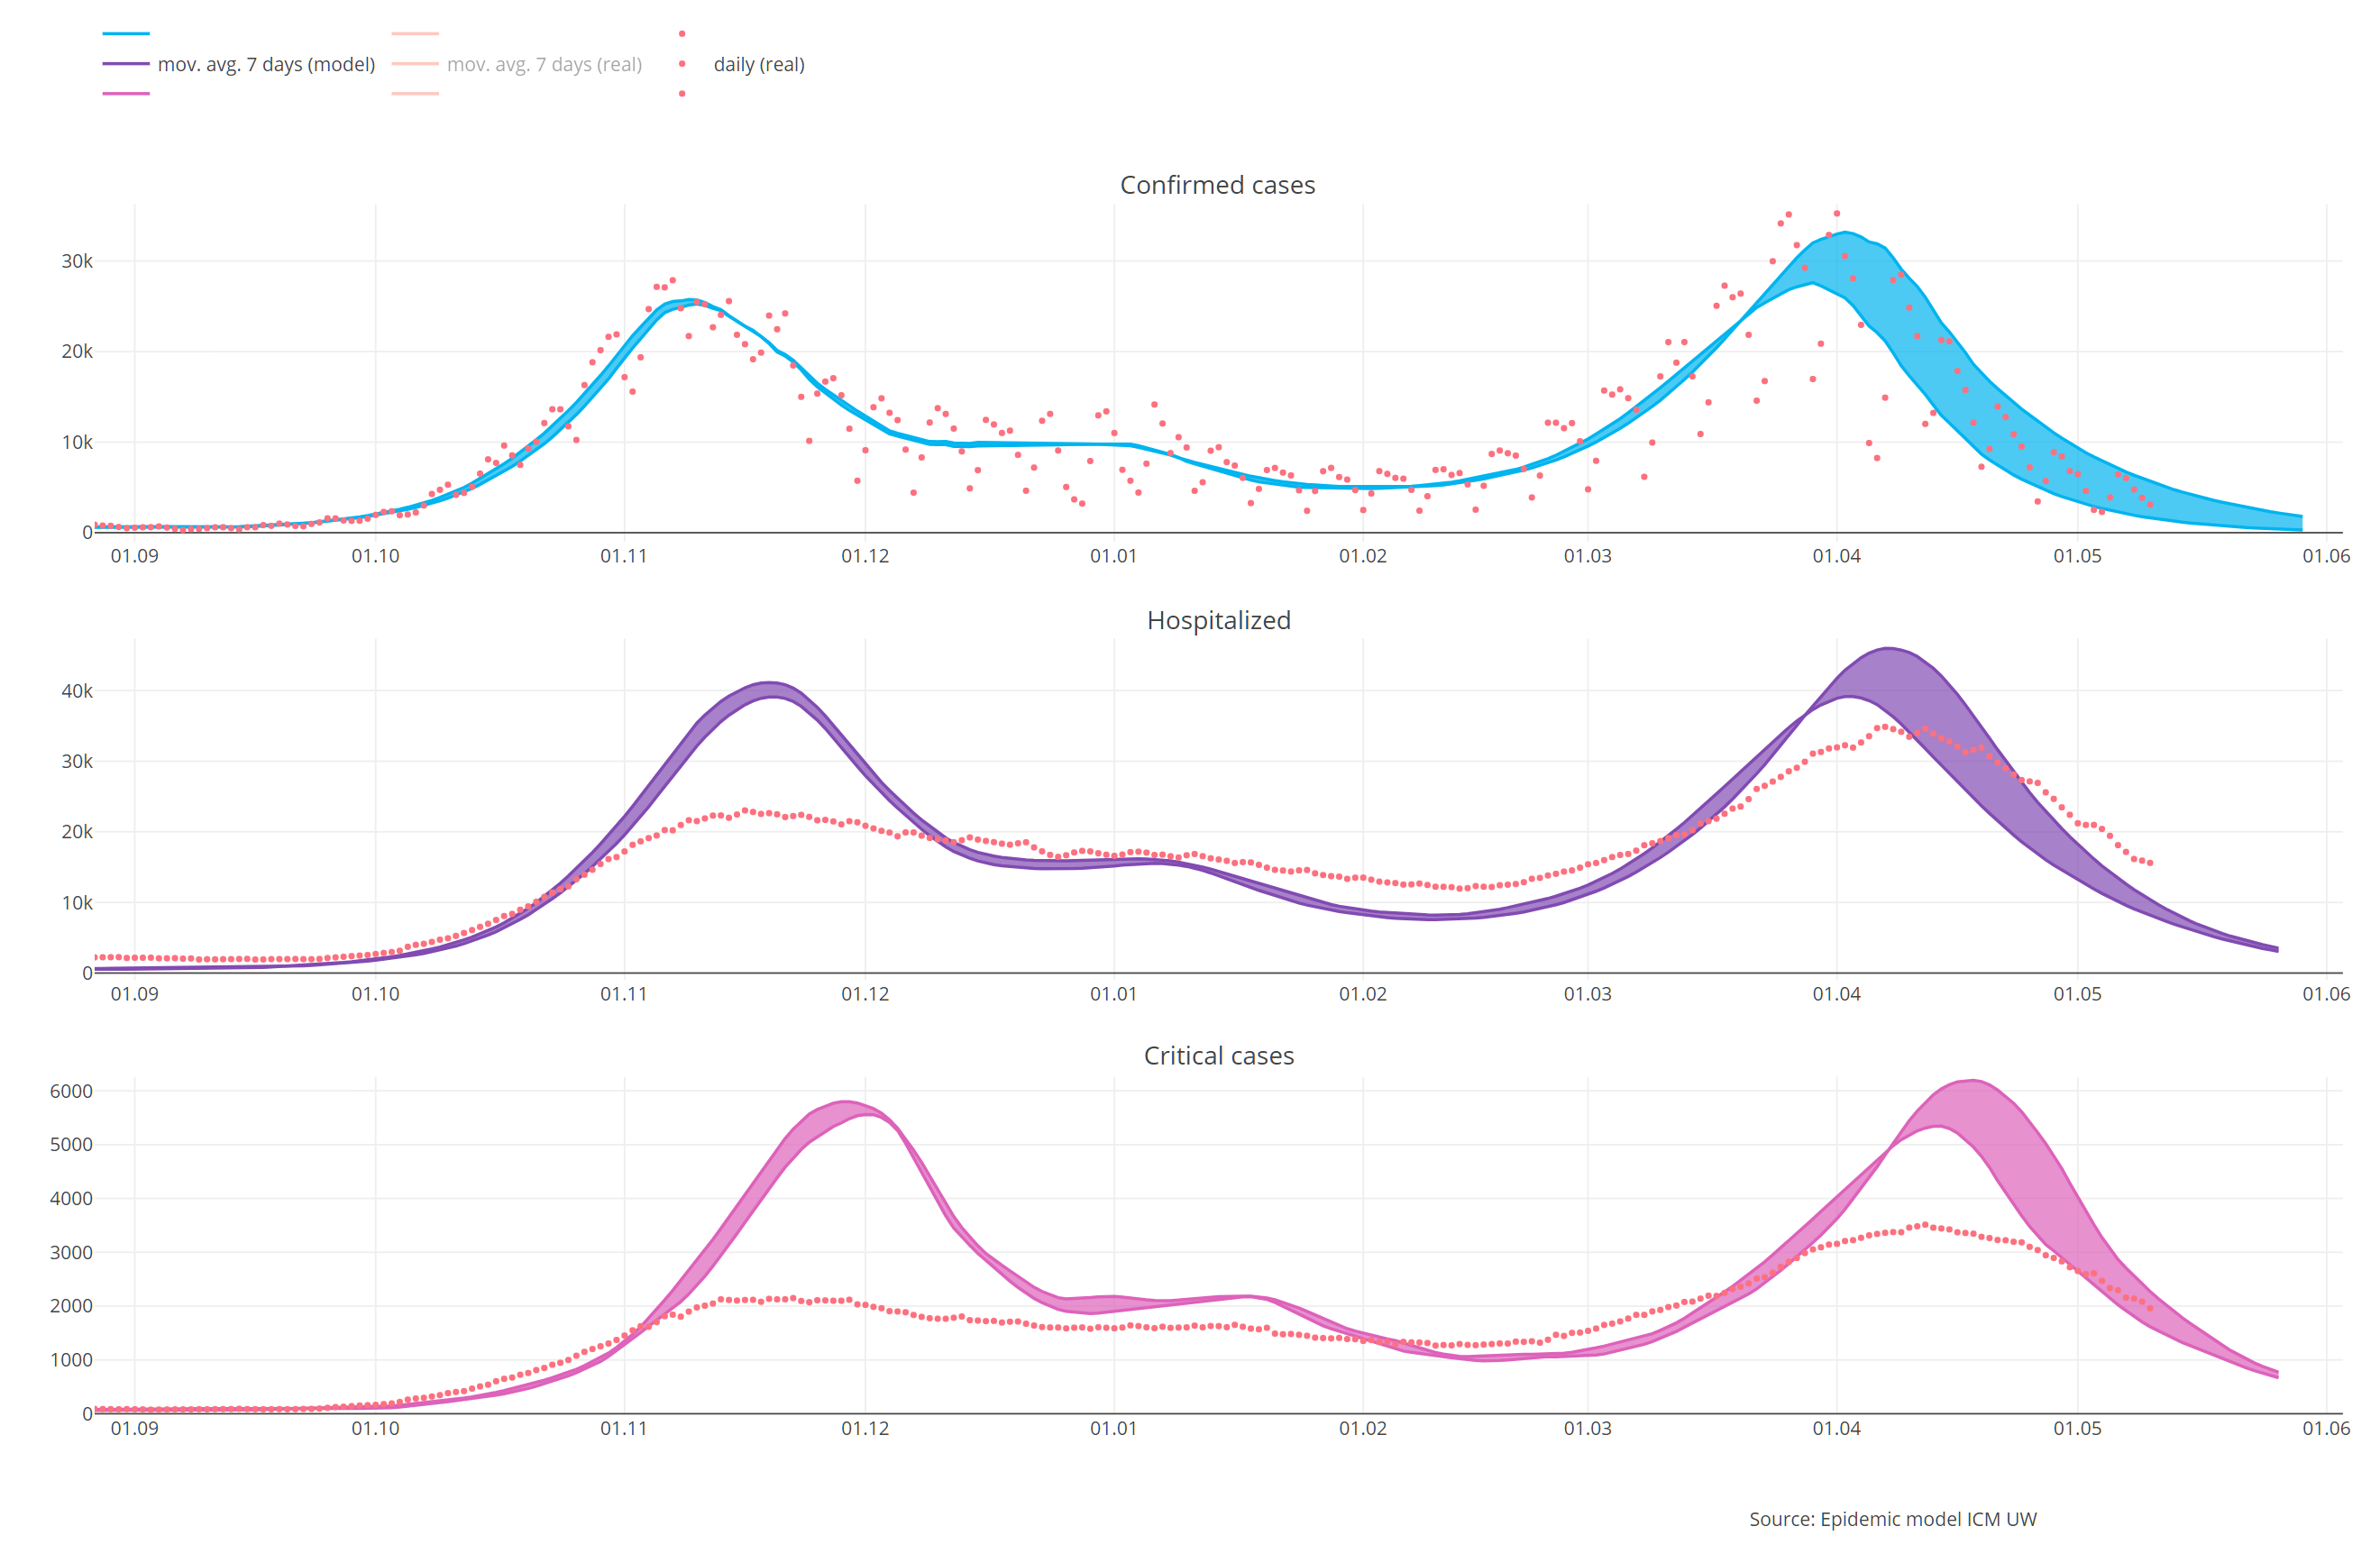
Comments to the forecasts of confirmed cases:
We present the 1B wave forecast (the wave caused by the Omikron variant).
The oncoming wave, due to the high transmissibility of the virus, will certainly manifest itself in strong accumulation of the reported cases. With the current level of detection (understood as the quotient of the identified cases and all actual infections) maintained, this would result in readings of identified cases even at the level of 140,000. cases per day. It is known, however, that in Poland the testing system has a limited capacity – so we show a presumably lower course of the identified cases, taking into account the limited capacity of the testing system.
Numbers of identified cases (reported data MoH) from February 8, 2022 are given together with reinfections.
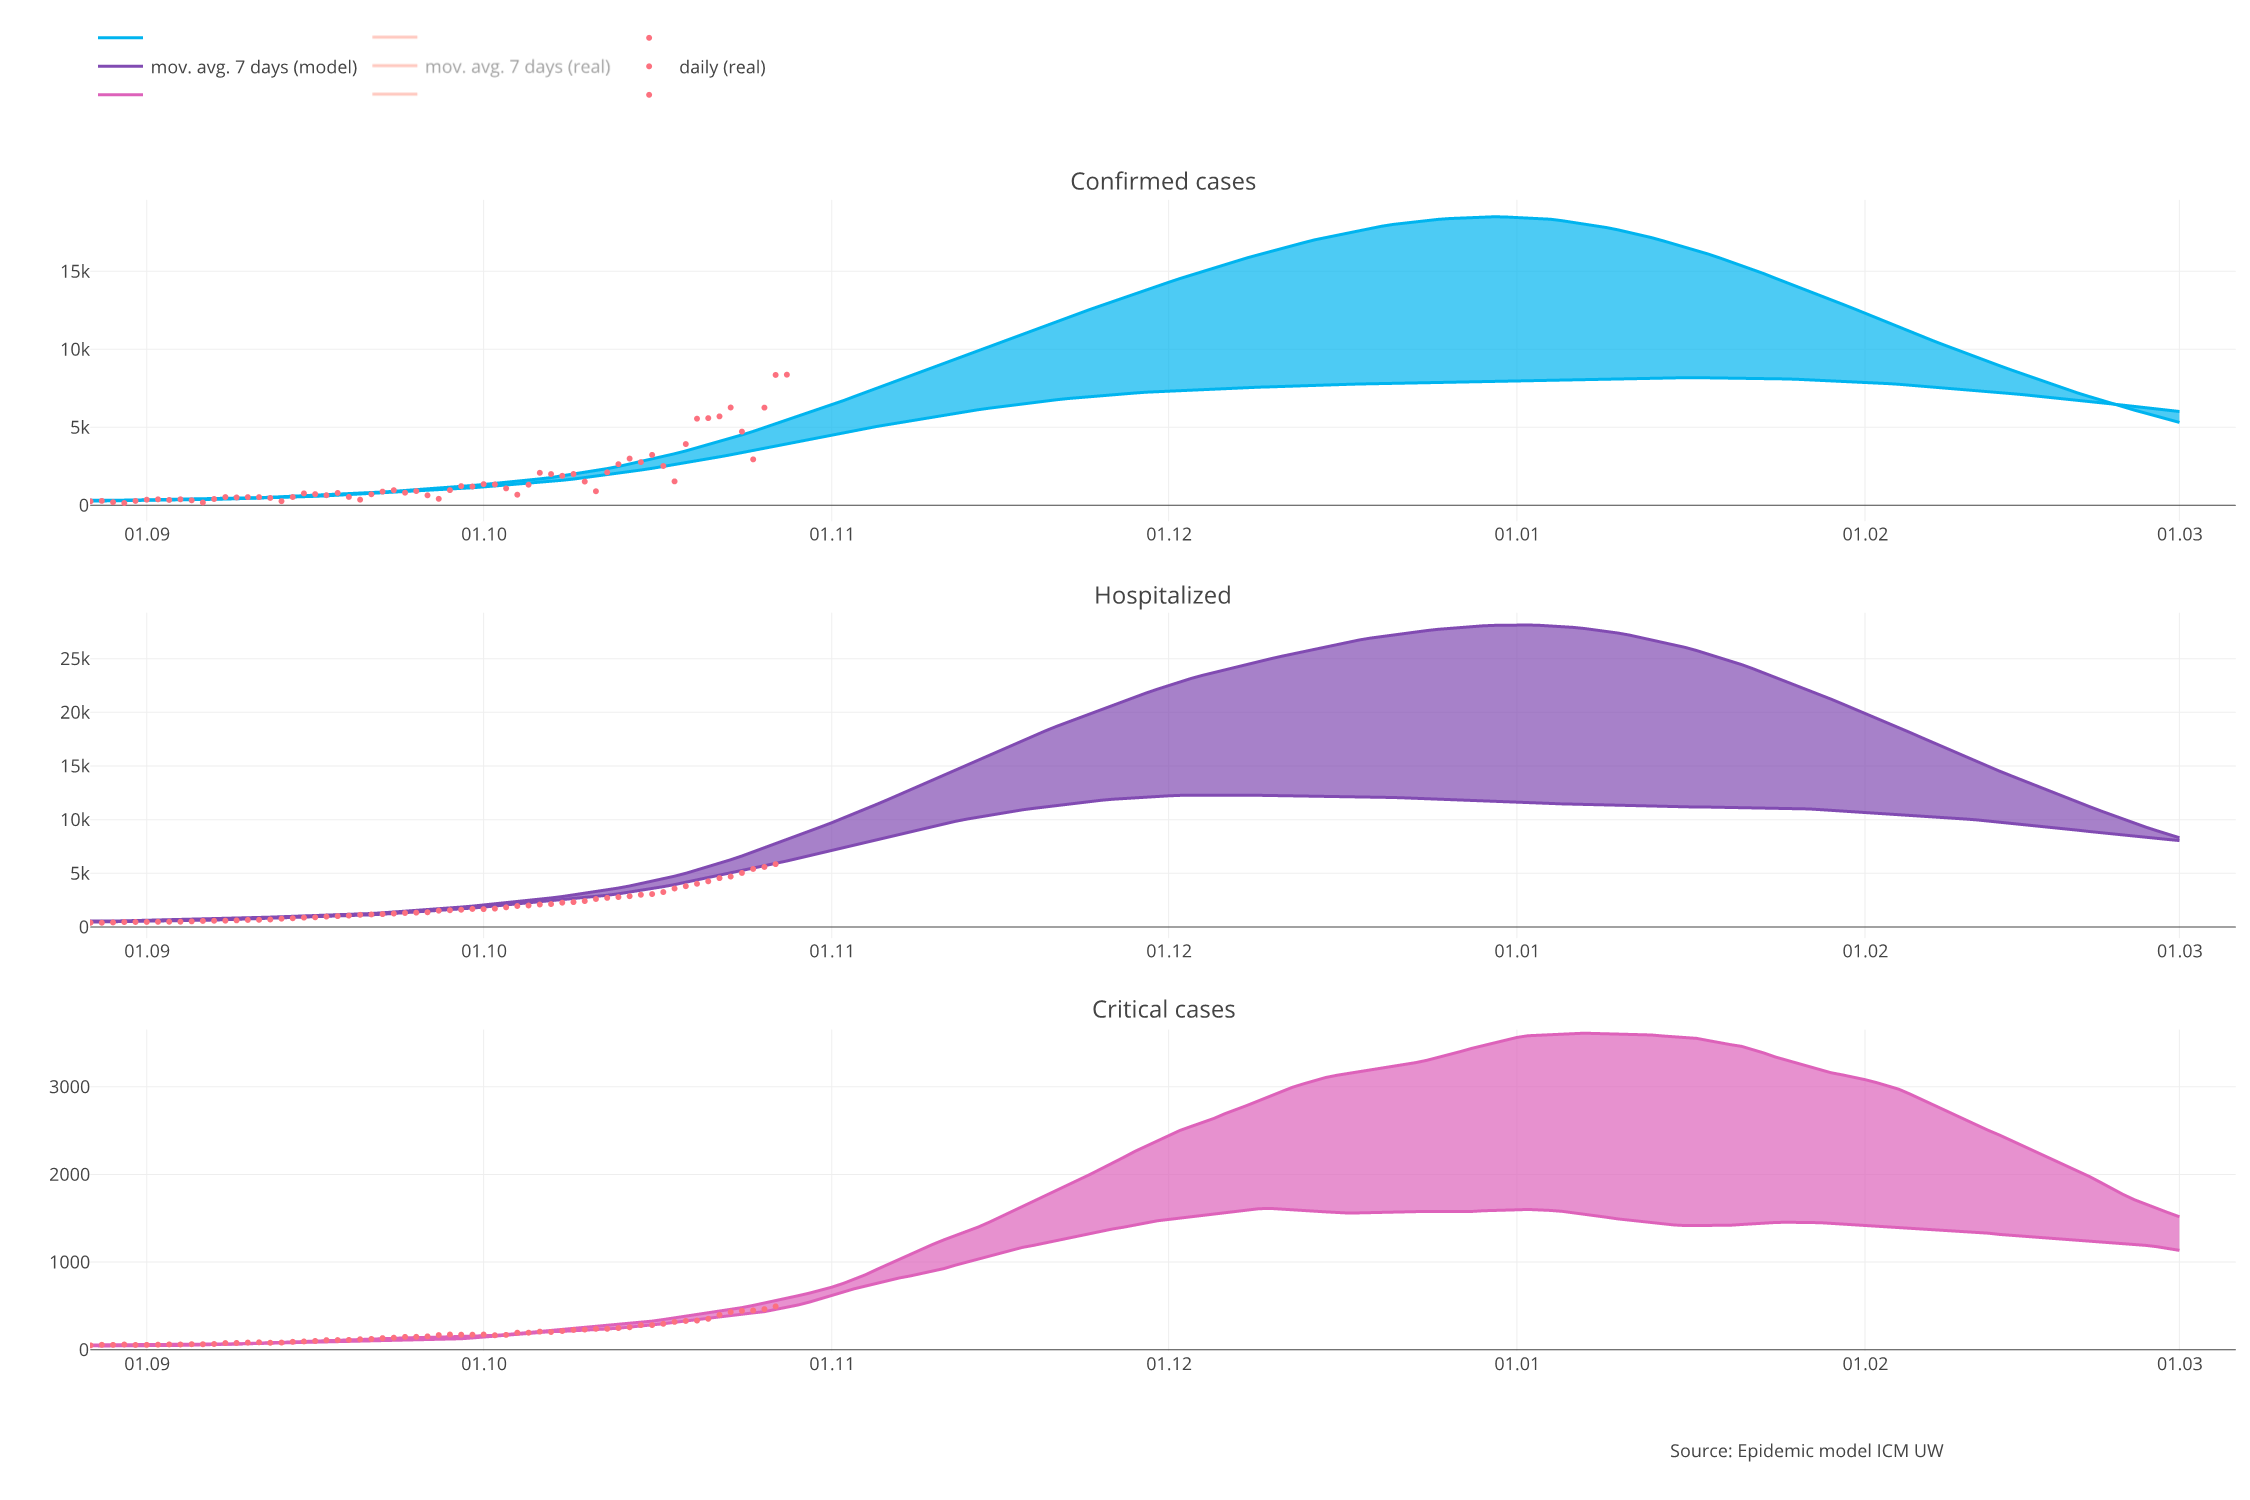
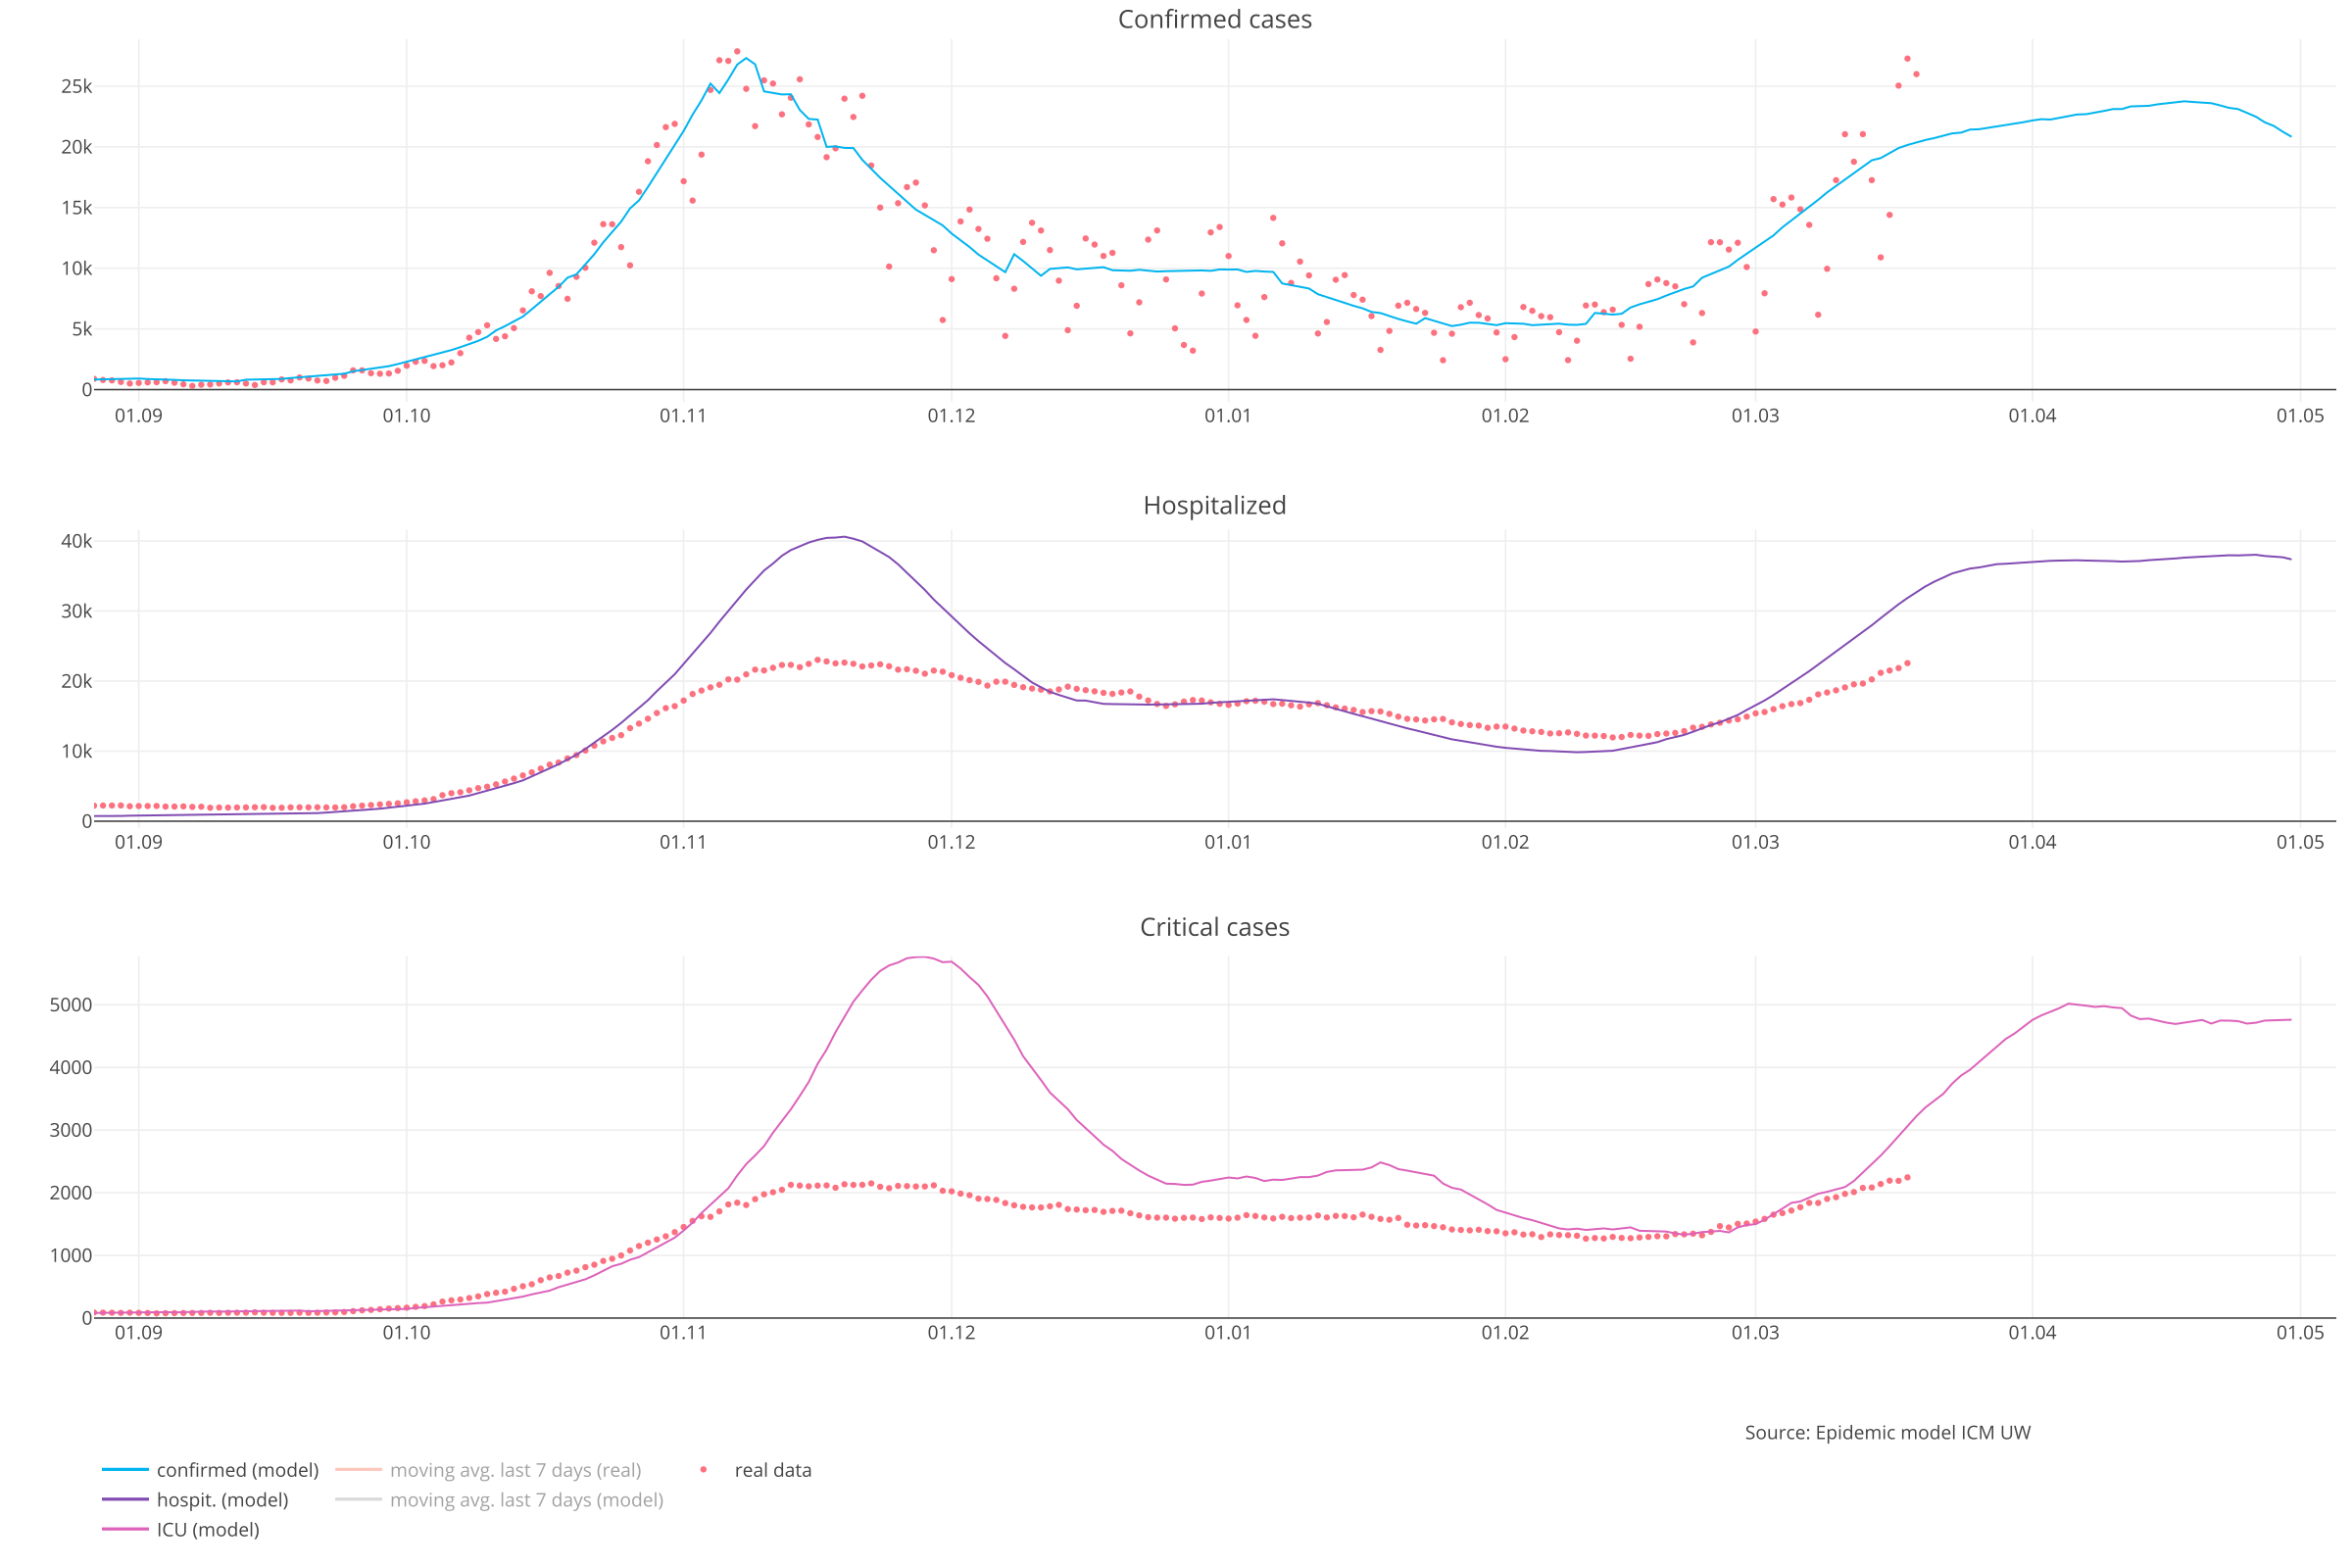
Comments on the prognosis of hospitalization:
As always, we present the forecasts of the required beds for COVID-19 patients. These numbers usually exceed the reported data – this is due to the fact that part of the population does not report to hospitals and the fact that, during the increase in occupancy, hospitals apply a resource-saving policy.
Currently, scientific reports from around the world differ in the assessment of the hospitalization rate. Therefore, in our forecasts, we show the lower and upper variants of the occupancy of the beds. In the current forecast, the pessimistic course of the occupied hospital beds has been lowered. Currently, the pessimistic variant indicates approx. 48 thousand. occupied beds in the rush. This is due not only to the lower rate of admissions to hospitals, but also to the shorter hospitalization period, which in most countries has been reduced from 10 days for Delta to about 5 days for Omikron.
Approximately 20.5 million people who received at least one dose of the vaccine were vaccinated. Data updated on December 10, 2021
Download full resolution chart
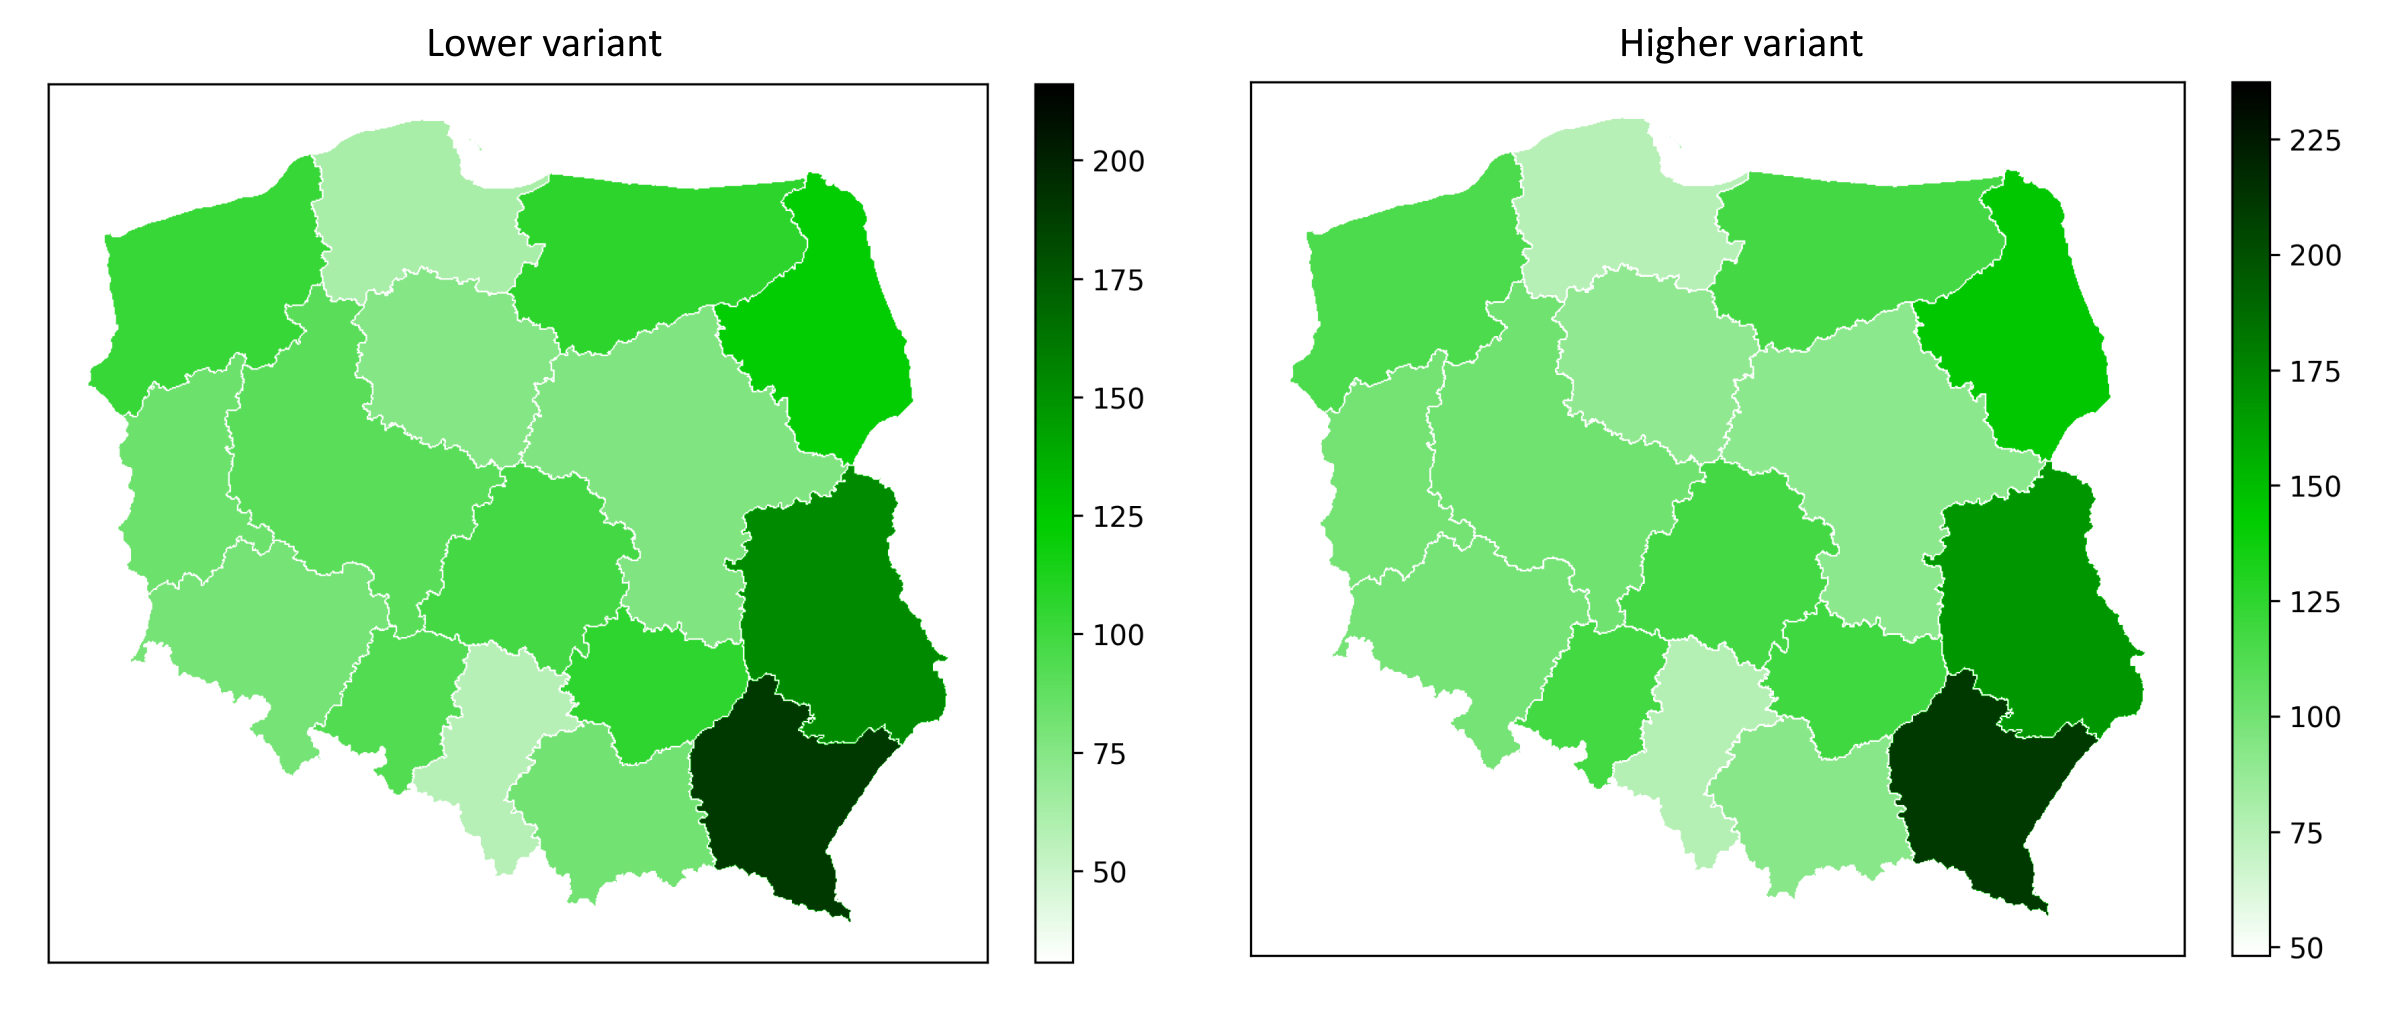
Prediction of the maximum occupancy of hospitals
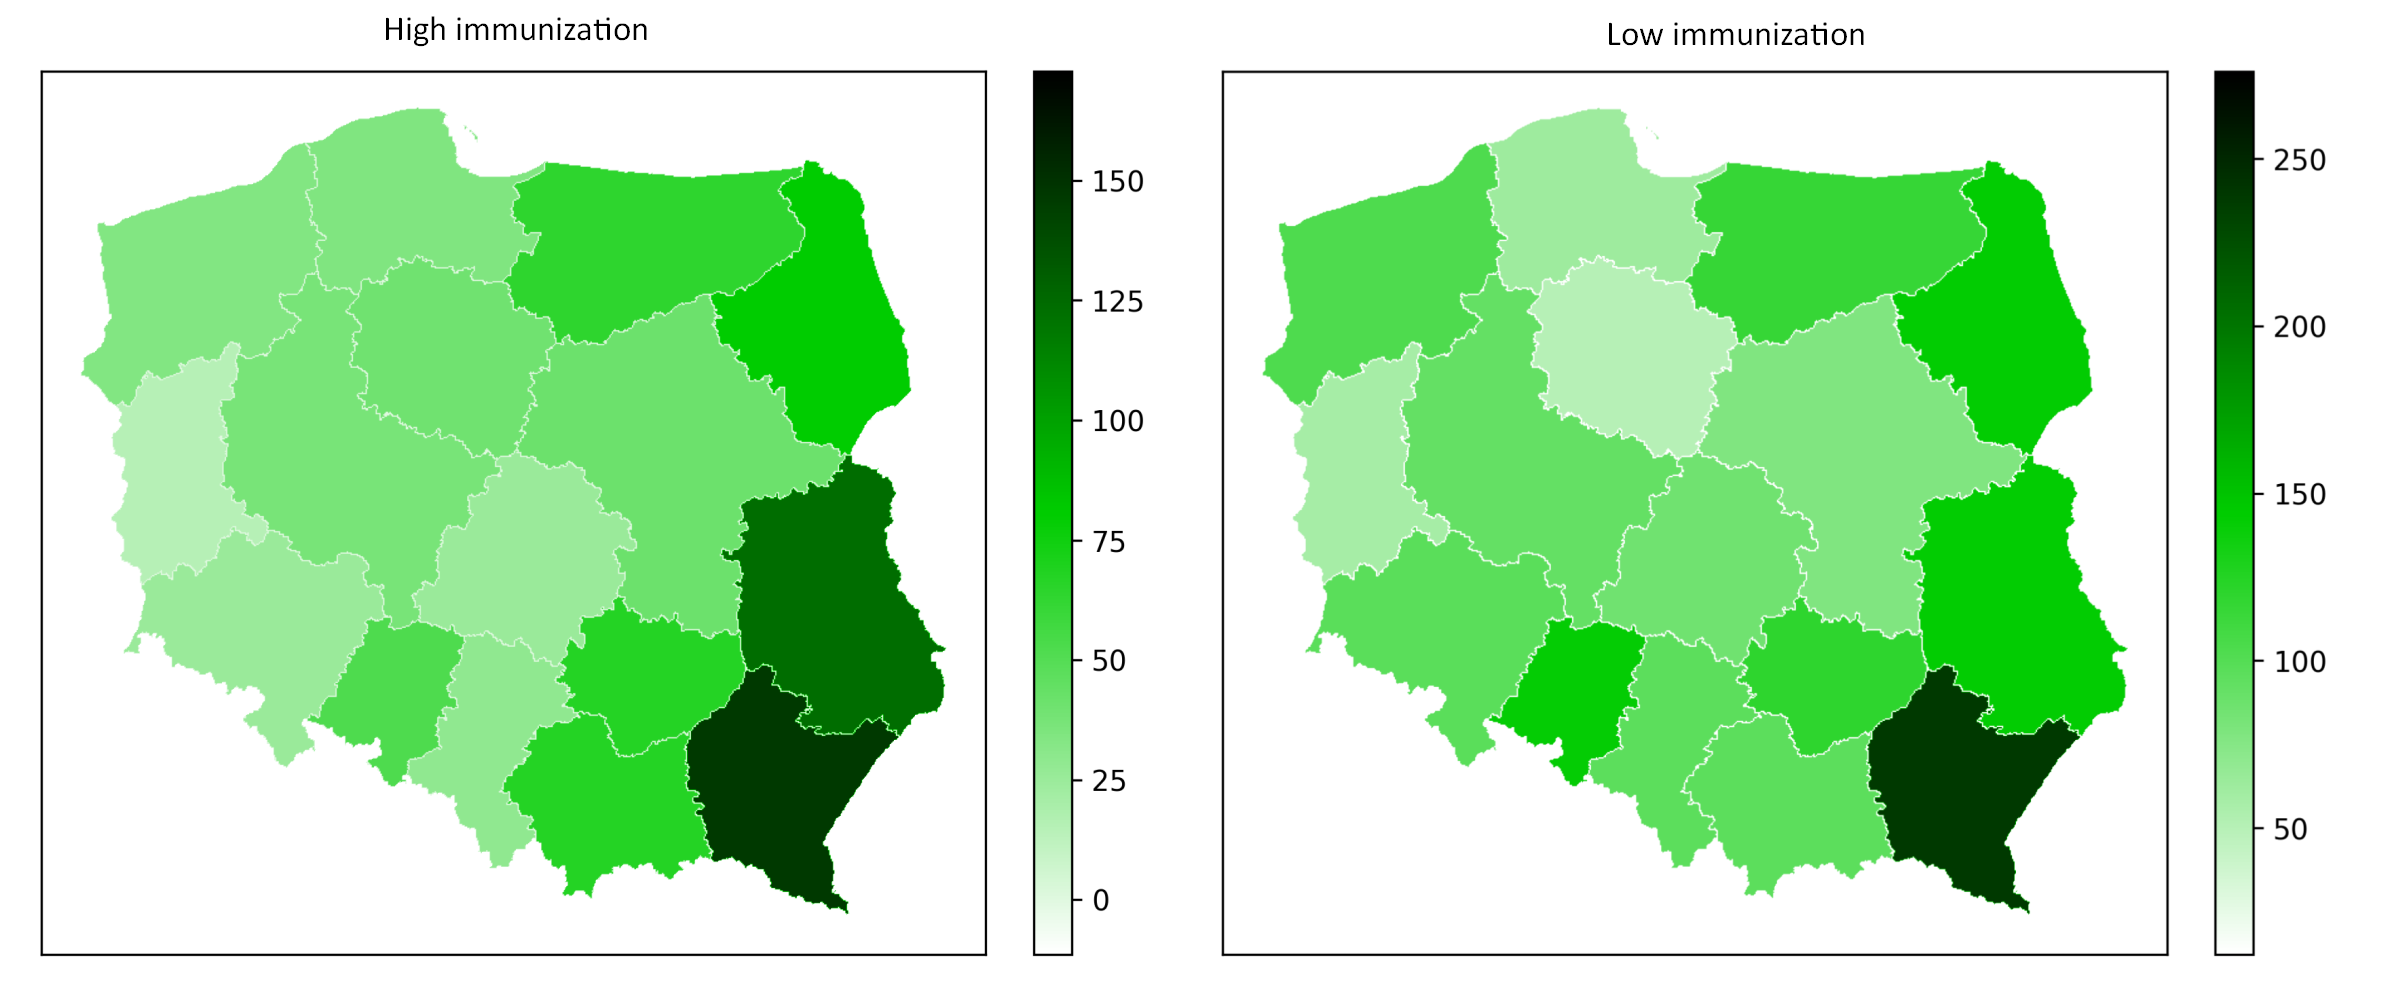
Additionally, we present the forecasted maximum number of people requiring hospitalization (occupied beds at the peak of the wave) per 100,000 inhabitants, in the voivodship resolution. Data are presented for high and low immunization (percentage of recoveries in the August 1 population is about 42% or about 52%).
Download full resolution chart
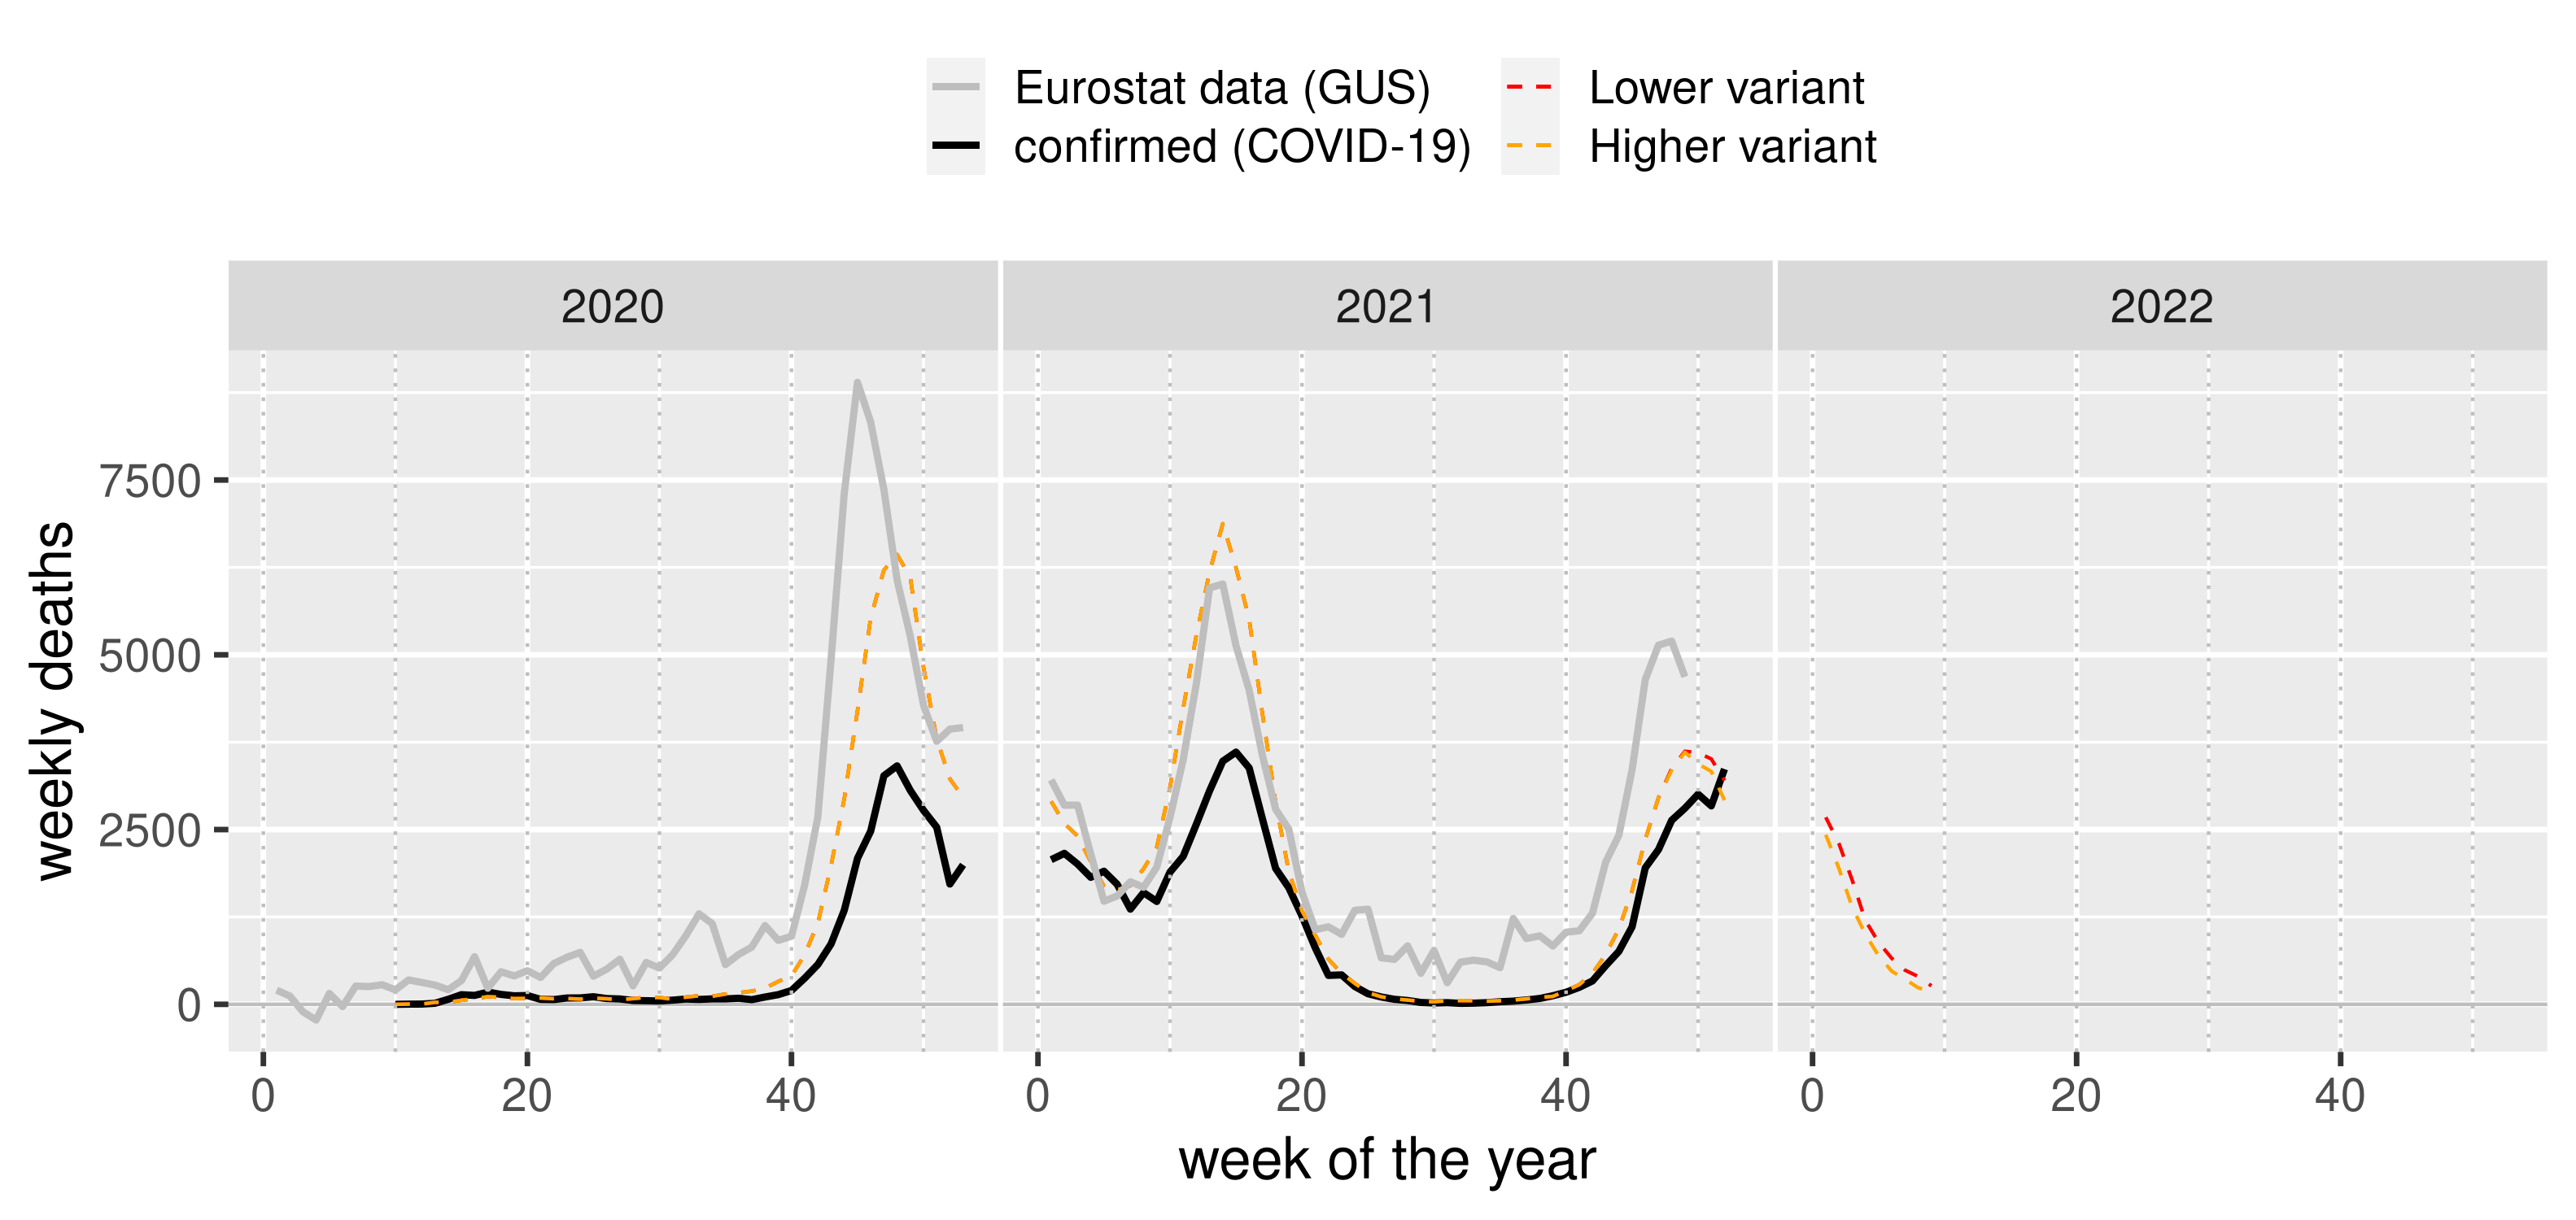
Excessive number of deaths
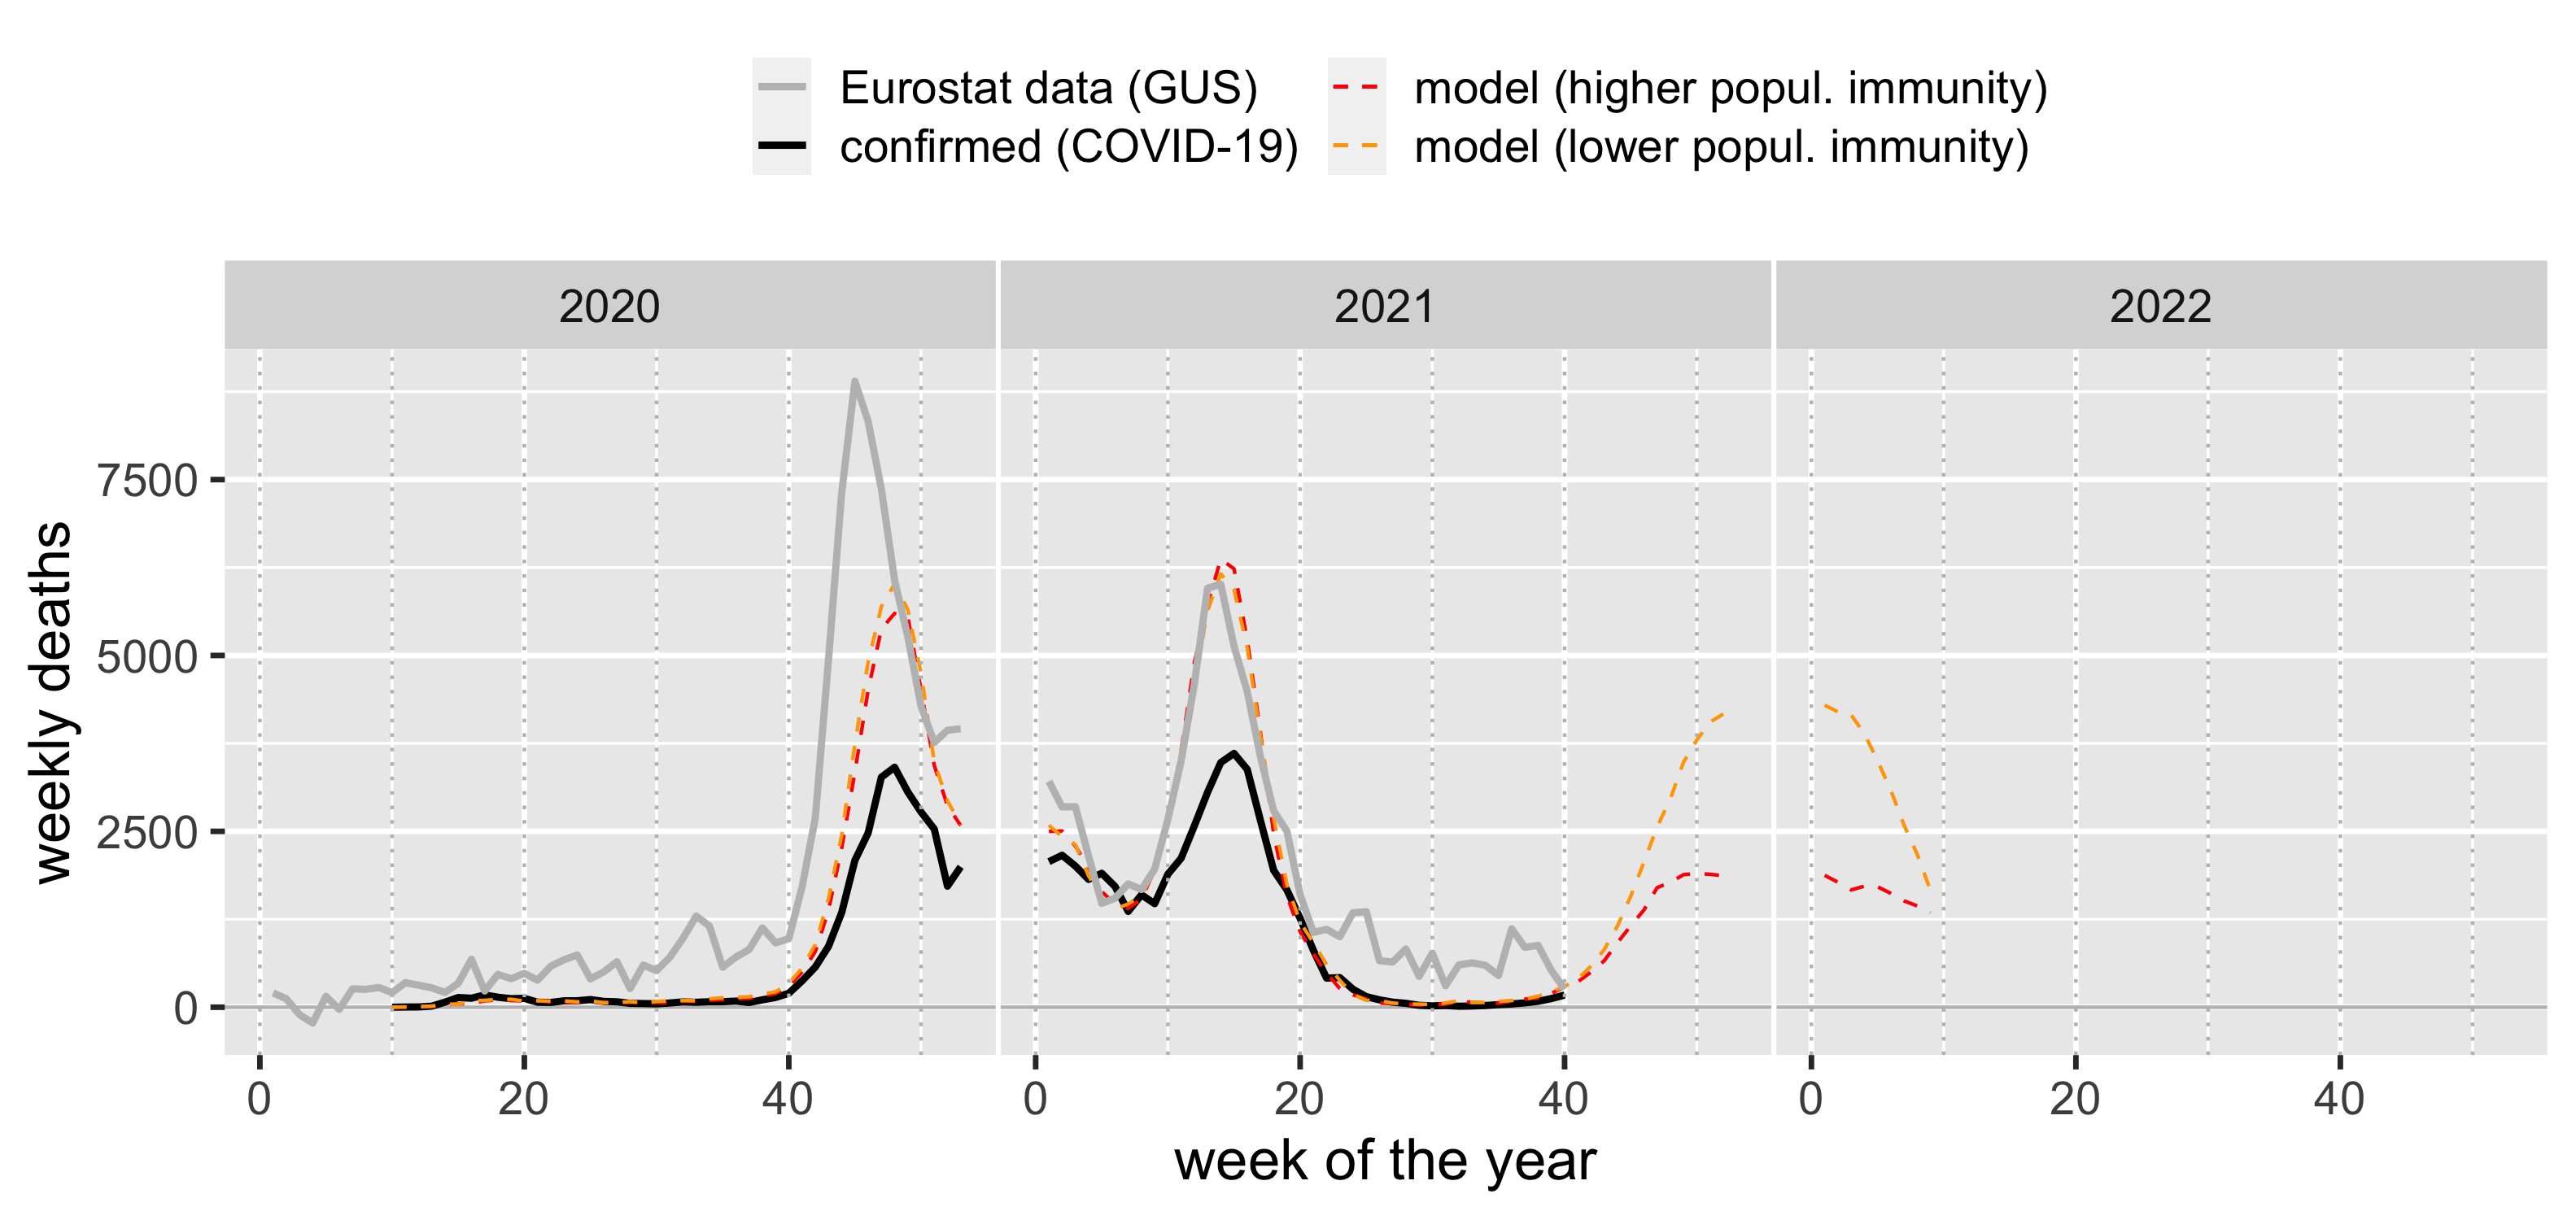
The plot below shows weekly deaths in our model, confirmed COVID-19 deaths and excessive number of deaths based on Eurostat (GUS) data (avg. weekly deaths 2010-2019 substracted from weekly deaths 2020 and 2021).
Dynamic chart of identified cases of Covid-19 infection in the period from March 16, 2020 with a prediction to March 1, 2022.
Chart prepared on the basis of the forecast of December 9, 2021.
The current forecast takes into account all historically introduced restrictions, the holiday period and the return to the social situation from September 2020 and then increasing the intensity of social contacts before Christmas and the closure of schools on December 20.
The epidemic spreading scenarios are presented with the assumption of population immunity of about 43% of recoveries on September 10/2021, in two variants. The higher variant assumes the way society functions unchanged under the influence of growth. The lower variant, on the other hand, assumes that the society, under the influence of information about the growing epidemic wave, limits the number of social contacts and hospitals introduce carefull management of hospital beds, e.g. by shortening hospitalization time whenever possible.
Approximately 20.5 million people who received at least one dose of the vaccine were vaccinated. Data updated on November 25, 2021
Download full resolution chart
Prediction of the maximum occupancy of hospitals
Additionally, we present the forecasted maximum number of people requiring hospitalization (occupied beds at the peak of the wave) per 100,000 inhabitants, in the voivodship resolution. Data are presented for high and low immunization (percentage of recoveries in the August 1 population is about 42% or about 52%).
Download full resolution chart
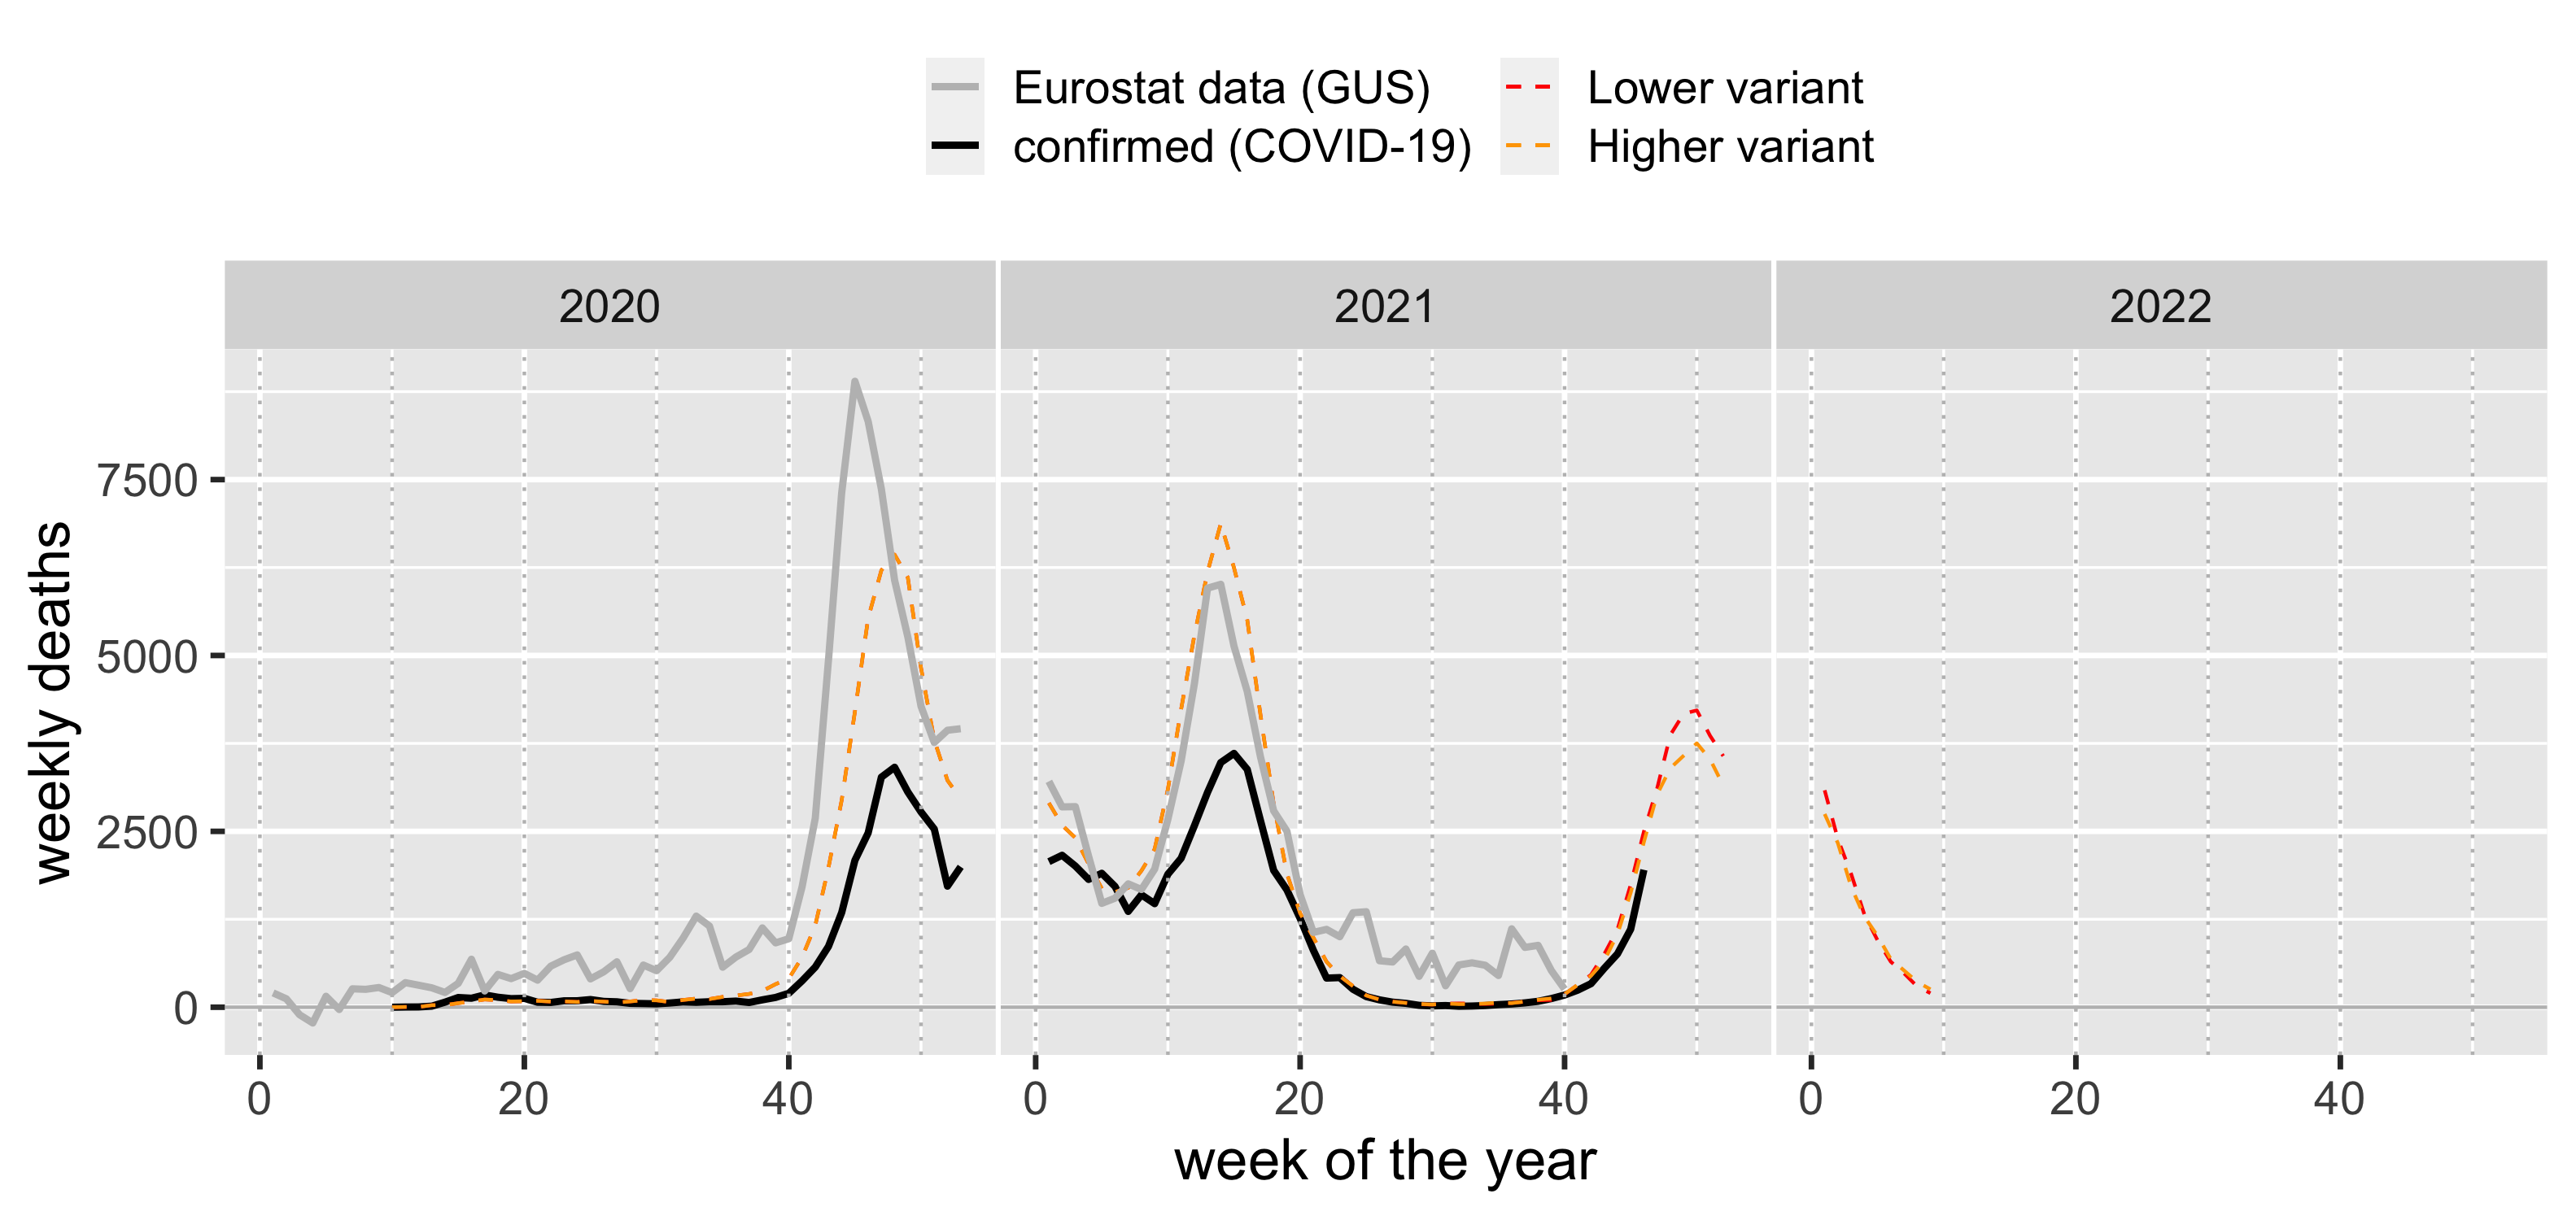
Excessive number of deaths
The plot below shows weekly deaths in our model, confirmed COVID-19 deaths and excessive number of deaths based on Eurostat (GUS) data (avg. weekly deaths 2010-2019 substracted from weekly deaths 2020 and 2021).
Dynamic chart of identified cases of Covid-19 infection in the period from March 16, 2020 with a prediction to March 1, 2022.
Chart prepared on the basis of the forecast of November 4, 2021. Forecasts for hospitalization, ICU and deaths based on the simulation of November 25, 2021.
The current forecast takes into account all historically introduced restrictions, the holiday period and the return to the social situation from September 2020.
The epidemic spreading scenarios are presented with the assumption of population immunity of about 43% of recoveries on September 10/2021, in two variants. The higher variant assumes the way society functions unchanged under the influence of growth. The lower variant, on the other hand, assumes that the society, under the influence of information about the growing epidemic wave, limits the number of social contacts and hospitals introduce carefull management of hospital beds, e.g. by shortening hospitalization time whenever possible.
Approximately 20.5 million people who received at least one dose of the vaccine were vaccinated. Data updated on November 25, 2021.
Download full resolution chart
Prediction of the maximum occupancy of hospitals
Additionally, we present the forecasted maximum number of people requiring hospitalization (occupied beds at the peak of the wave) per 100,000 inhabitants, in the voivodship resolution. Data are presented for high and low immunization (percentage of recoveries in the August 1 population is about 42% or about 52%).
Download full resolution chart
Excessive number of deaths
The plot below shows weekly deaths in our model, confirmed COVID-19 deaths and excessive number of deaths based on Eurostat (GUS) data (avg. weekly deaths 2010-2019 substracted from weekly deaths 2020 and 2021).

Dynamic chart of identified cases of Covid-19 infection in the period from 06/15/2020 with a prediction until 03/01/2021.
Chart prepared on the basis of the forecast from 10/28/2021.
The current forecast takes into account all historically introduced restrictions, the holiday period and the return to the social situation from September 2020.
Approximately 19.8 million people were vaccinated, who have taken at least one dose of the vaccine.
The epidemic spreading scenarios are presented in two variants of the population resistance level – the percentage of recoveries in the population on August 1 is about 42% or about 52%.
Download full resolution chart
Prediction of the maximum occupancy of hospitals
Additionally, we present the forecasted maximum number of people requiring hospitalization (occupied beds at the peak of the wave) per 100,000 inhabitants, in the voivodship resolution. Data are presented for high and low immunization (percentage of recoveries in the August 1 population is about 42% or about 52%).
Download full resolution chart
Excessive number of deaths
The plot below shows weekly deaths in our model, confirmed COVID-19 deaths and excessive number of deaths based on Eurostat (GUS) data (avg. weekly deaths 2010-2019 substracted from weekly deaths 2020 and 2021).
Dynamic chart of identified cases of Covid-19 infection in the period from 06/15/2020 with a prediction until 03/01/2021.
Chart prepared on the basis of the forecast from 10/13/2021.
The current forecast takes into account all historically introduced restrictions, the holiday period and the return to the social situation from September 2020.
Approximately 19.8 million people were vaccinated, who have taken at least one dose of the vaccine.
The epidemic spreading scenarios are presented in two variants of the population resistance level – the percentage of recoveries in the population on August 1 is about 42% or about 52%.
Download full resolution chart
Prediction of the maximum occupancy of hospitals
Additionally, we present the forecasted maximum number of people requiring hospitalization (occupied beds at the peak of the wave) per 100,000 inhabitants, in the voivodship resolution. Data are presented for high and low immunization (percentage of recoveries in the August 1 population is about 42% or about 52%).
Download full resolution chart
Excessive number of deaths
The plot below shows weekly deaths in our model, confirmed COVID-19 deaths and excessive number of deaths based on Eurostat (GUS) data (avg. weekly deaths 2010-2019 substracted from weekly deaths 2020 and 2021).
Dynamic chart of identified cases of Covid-19 infection in the period from 06/15/2020 with a prediction until 10/31/2021.
Chart prepared on the basis of the forecast from 10/01/2021.
The current forecast takes into account all historically introduced restrictions, the holiday period and the return to the social situation from September 2020.
Approximately 19.4 million people were vaccinated.
The epidemic spreading scenarios are presented in two variants of the population resistance level – the percentage of recoveries in the population on August 1 is about 41% or about 51%.
Download the full resolution chart
Excessive number of deaths in 2020
The plot below shows weekly deaths in our model, confirmed COVID-19 deaths and excessive number of deaths based on Eurostat (GUS) data (avg. weekly deaths 2010-2019 substracted from weekly deaths 2020 and 2021).
Dynamic chart of identified cases of Covid-19 infection in the period from 06/15/2020 with a prediction until 10/05/2021.
Chart prepared on the basis of the forecast from 09/01/2021.
The current forecast takes into account all historically introduced restrictions, the holiday period and the return to the social situation from September 2020.
Vaccinations are implemented according to data provided by ECDC and take into account vaccinations for which the first dose was administered until August 14, 2021.
The epidemic spreading scenarios are presented in two variants of the population resistance level – the percentage of recoveries in the population on June 1 is about 45% or about 57%.
Download the full resolution chart
Excessive number of deaths in 2020
The plot below shows weekly deaths in our model, confirmed COVID-19 deaths and excessive number of deaths based on Eurostat (GUS) data (avg. weekly deaths 2010-2019 substracted from weekly deaths 2020 and 2021).
Dynamic chart of identified cases of Covid-19 infection in the period from 06/15/2020 with a prediction until 07/31/2021.
Chart prepared on the basis of the forecast from 05/07/2021.
The current forecast takes into account all historically introduced restrictions and the planned May and June easing, and takes into account the fact that the school year ends on June 25, 2021.
We assume that each approved age group will no longer get vaccinated once vaccination coverage is reached at 70%.
The epidemic spreading scenarios are presented in two variants of the population resistance level – the percentage of recoveries in the population on June 1 is about 45% or about 57%.
Download the full resolution chart
Excessive number of deaths in 2020
The plot below shows weekly deaths in our model, confirmed COVID-19 deaths and excessive number of deaths based on Eurostat (GUS) data (avg. weekly deaths 2010-2019 substracted from weekly deaths 2020 and 2021).
Dynamic chart of identified cases of Covid-19 infection in the period from 03/16/2020 with a prediction until 07/31/2021.
Chart prepared on the basis of the forecast from 05/07/2021.
The current forecast takes into account all the historically introduced restrictions and the planned May easing:
• 08.05 opening hotels at 50%,
• 15.05 opening of restaurant gardens and opening of classes 4-12 in hybrid mode,
• 29.05 opening of restaurants and cinemas at 50%, gym with limits, opening of all schools.
In the current forecast scenarios, we assume that by the end of Q2 2021:
• the number of people vaccinated with the first dose will be around 20.9 million,
• including about 17.1 million vaccinated with the first dose of mRNA vaccine,
• about 3.8 million vaccinated with the first dose of the vector vaccine.
The epidemic spreading scenarios are presented in two variants of the population immunization level – the percentage of recoveries in the population on April 1 is about 35% or about 45%.
Download full resolution chart.
Excessive number of deaths in 2020
The plot below shows weekly deaths in our model, confirmed COVID-19 deaths and excessive number of deaths based on Eurostat (GUS) data (avg. weekly deaths 2010-2019 substracted from weekly deaths 2020 and 2021).
Dynamic chart of identified cases of Covid-19 infection in the period from 03/16/2020 with a prediction until 05/31/2021.
Chart prepared on the basis of the forecast from 03/19/2021.
The forecast takes into account:
– classes 1-3 open on January 18
– reduction of restrictions on February 1 and 12
– regional closure of voivodships on February 26, March 6 and March 13
– nationwide lockdown on March 20.
The forecast takes into account the declining level of social acceptance for administrative restrictions and the increased holiday activity related to the reduction of restrictions on February 12.
We consider the vaccination program in the forecast as follows:
700-900 thousand monthly vaccinated with the first dose of Comirnata (Pfizer). In addition, we include vaccinations with the first dose of AstraZeneca at the level of 830,000. people per month from February 15.
The forecast takes into account the presence of the British variant of the virus (VOC-202012/01). The forecast assumed that the share of the British variant in new cases found at the beginning of February was around 20%, and at the beginning of March it was already over 60%.
The forecast assumes that the actual number of people infected with the Sars-Cov-2 virus is lower than in previous forecasts. The current forecast assumes that as of March 1 the cumulative amount of actual infections amounts to approx. 25% of the population.
Download full resolution chart.
Excessive number of deaths in 2020
The plot below shows weekly deaths in our model, confirmed COVID-19 deaths and excessive number of deaths based on Eurostat (GUS) data (avg. weekly deaths 2010-2019 substracted from weekly deaths 2020 and 2021).
Dynamic chart of identified cases of Covid-19 infection in the period from 03/16/2020 with a prediction until 04/30/2021.
Chart prepared on the basis of the forecast from 03/12/2021.
The forecast takes into account the opening of classes 1-3 on January 18 and two stages of reduction of restrictions announced in February 2021:
– February 1: opening of shopping malls and museums
– February 12: opening of cinemas, theaters, swimming pools, hotels, slopes, swimming pools.
The forecast takes into account the decreasing level of social acceptance for administrative restrictions and the increased holiday activity related to the reduction of restrictions on February 12.
We includes the vaccination program in the forecast as follows:
700-900 thousand monthly vaccinated with the first dose of Comirnata (Pfizer). In addition, we include vaccinations with the first dose of AstraZeneca at the level of 830,000. people per month from February 15.
The forecast takes into account the presence of the British variant of the virus (VOC-202012/01). The forecast assumed that the share of the British variant in new cases found at the beginning of February slightly exceeded 5%, and at the beginning of March it was already around 40%.
Dynamic chart of identified cases of Covid-19 infection in the period from 03/16/2020 with a prediction until 04/30/2021.
Chart prepared on the basis of the forecast from 01/03/2021.
The forecast takes into account the opening of classes 1-3 on January 18 and two stages of reduction of restrictions announced in February 2021:
– February 1: opening of shopping malls and museums
– February 12: opening of cinemas, theaters, swimming pools, hotels, slopes, swimming pools.
The forecast takes into account the decreasing level of social acceptance for administrative restrictions and the increased holiday activity related to the reduction of restrictions on February 12.
The forecast takes into account the introduction of a vaccination program according to the schedule.
The forecast takes into account the presence of the British variant of the virus (VOC-202012/01). The forecast assumed that the share of the British variant in new cases found at the beginning of February slightly exceeded 5%, and at the beginning of March it was already around 40%.
Dynamic chart of identified cases of Covid-19 infection in the period from 03/16/2020 with a prediction to 03/31/2021. Chart prepared on the basis of the forecast of 02/08/2020.
The forecast takes into account the opening of classes 1-3 grade on January 18 and two stages of reduction of restrictions, announced in February 2021:
– February 1: opening of shopping centers and museums
– February 12: opening of cinemas, theaters, swimming pools, hotels, slopes.
The forecast takes into account the declining level of public acceptance for administrative restrictions.
The forecast takes into account the introduction of a vaccination program according to the schedule.
Forecast does not take into account the risk of the British virus variant (VUI-202012/01)
Currently, it is estimated that the share of the British variant in the Polish population was about 8% at the beginning of February. The progression of the share of this variant will result in stronger increases than our model shows. We will be able to provide an accurate forecast, taking into account the infections caused by the new virus variant, as we receive data on the progression of the share of the new variant in the population.
Dynamic chart of identified cases of Covid-19 infection in the period from 03/16/2020 with a prediction to 01/31/2021. Chart prepared on the basis of the forecast of 01/11/2021
Below we present a forecast of the COVID-19 epidemic spread in Poland. The forecast results from simulations conducted with the use of the ICM UW epidemiological model. The simulations have been running since the beginning of the pandemic.
The forecast includes the introduction of a fuse (7.11), opening of shopping centers (6.12), increasing mobility in the pre-Christmas and New Year’s periods, the introduction of a national quarantine on 28.12 and opening grades 1-3 of primary schools.
National quarantine is introduced indefinitely, which is of course a purely model assumption and in fact the restrictions will certainly be modified.
The forecast does not take into account the scenarios of vaccinations of the population.
The chart is displayed by default from 01/09. Double-clicking returns to the chart view for the entire pandemic period.
Dynamic chart of identified cases of Covid-19 infection in the period from 03/16/2020 with a prediction to 01/31/2021.
Chart prepared on the basis of the forecast of 12/30/2020
Below we present a forecast of the COVID-19 epidemic spread in Poland. The forecast results from simulations conducted with the use of the ICM UW epidemiological model. The simulations have been running since the beginning of the pandemic.
The forecast includes the introduction of a fuse (7.11), opening of shopping centers (6.12), increasing mobility in the pre-Christmas and New Year’s periods and the introduction of a national quarantine on 28.12.
National quarantine is introduced indefinitely, which is of course a purely model assumption and in fact the restrictions will certainly be modified.
The forecast does not take into account the scenarios of opening schools after winter break and vaccinations of the population.
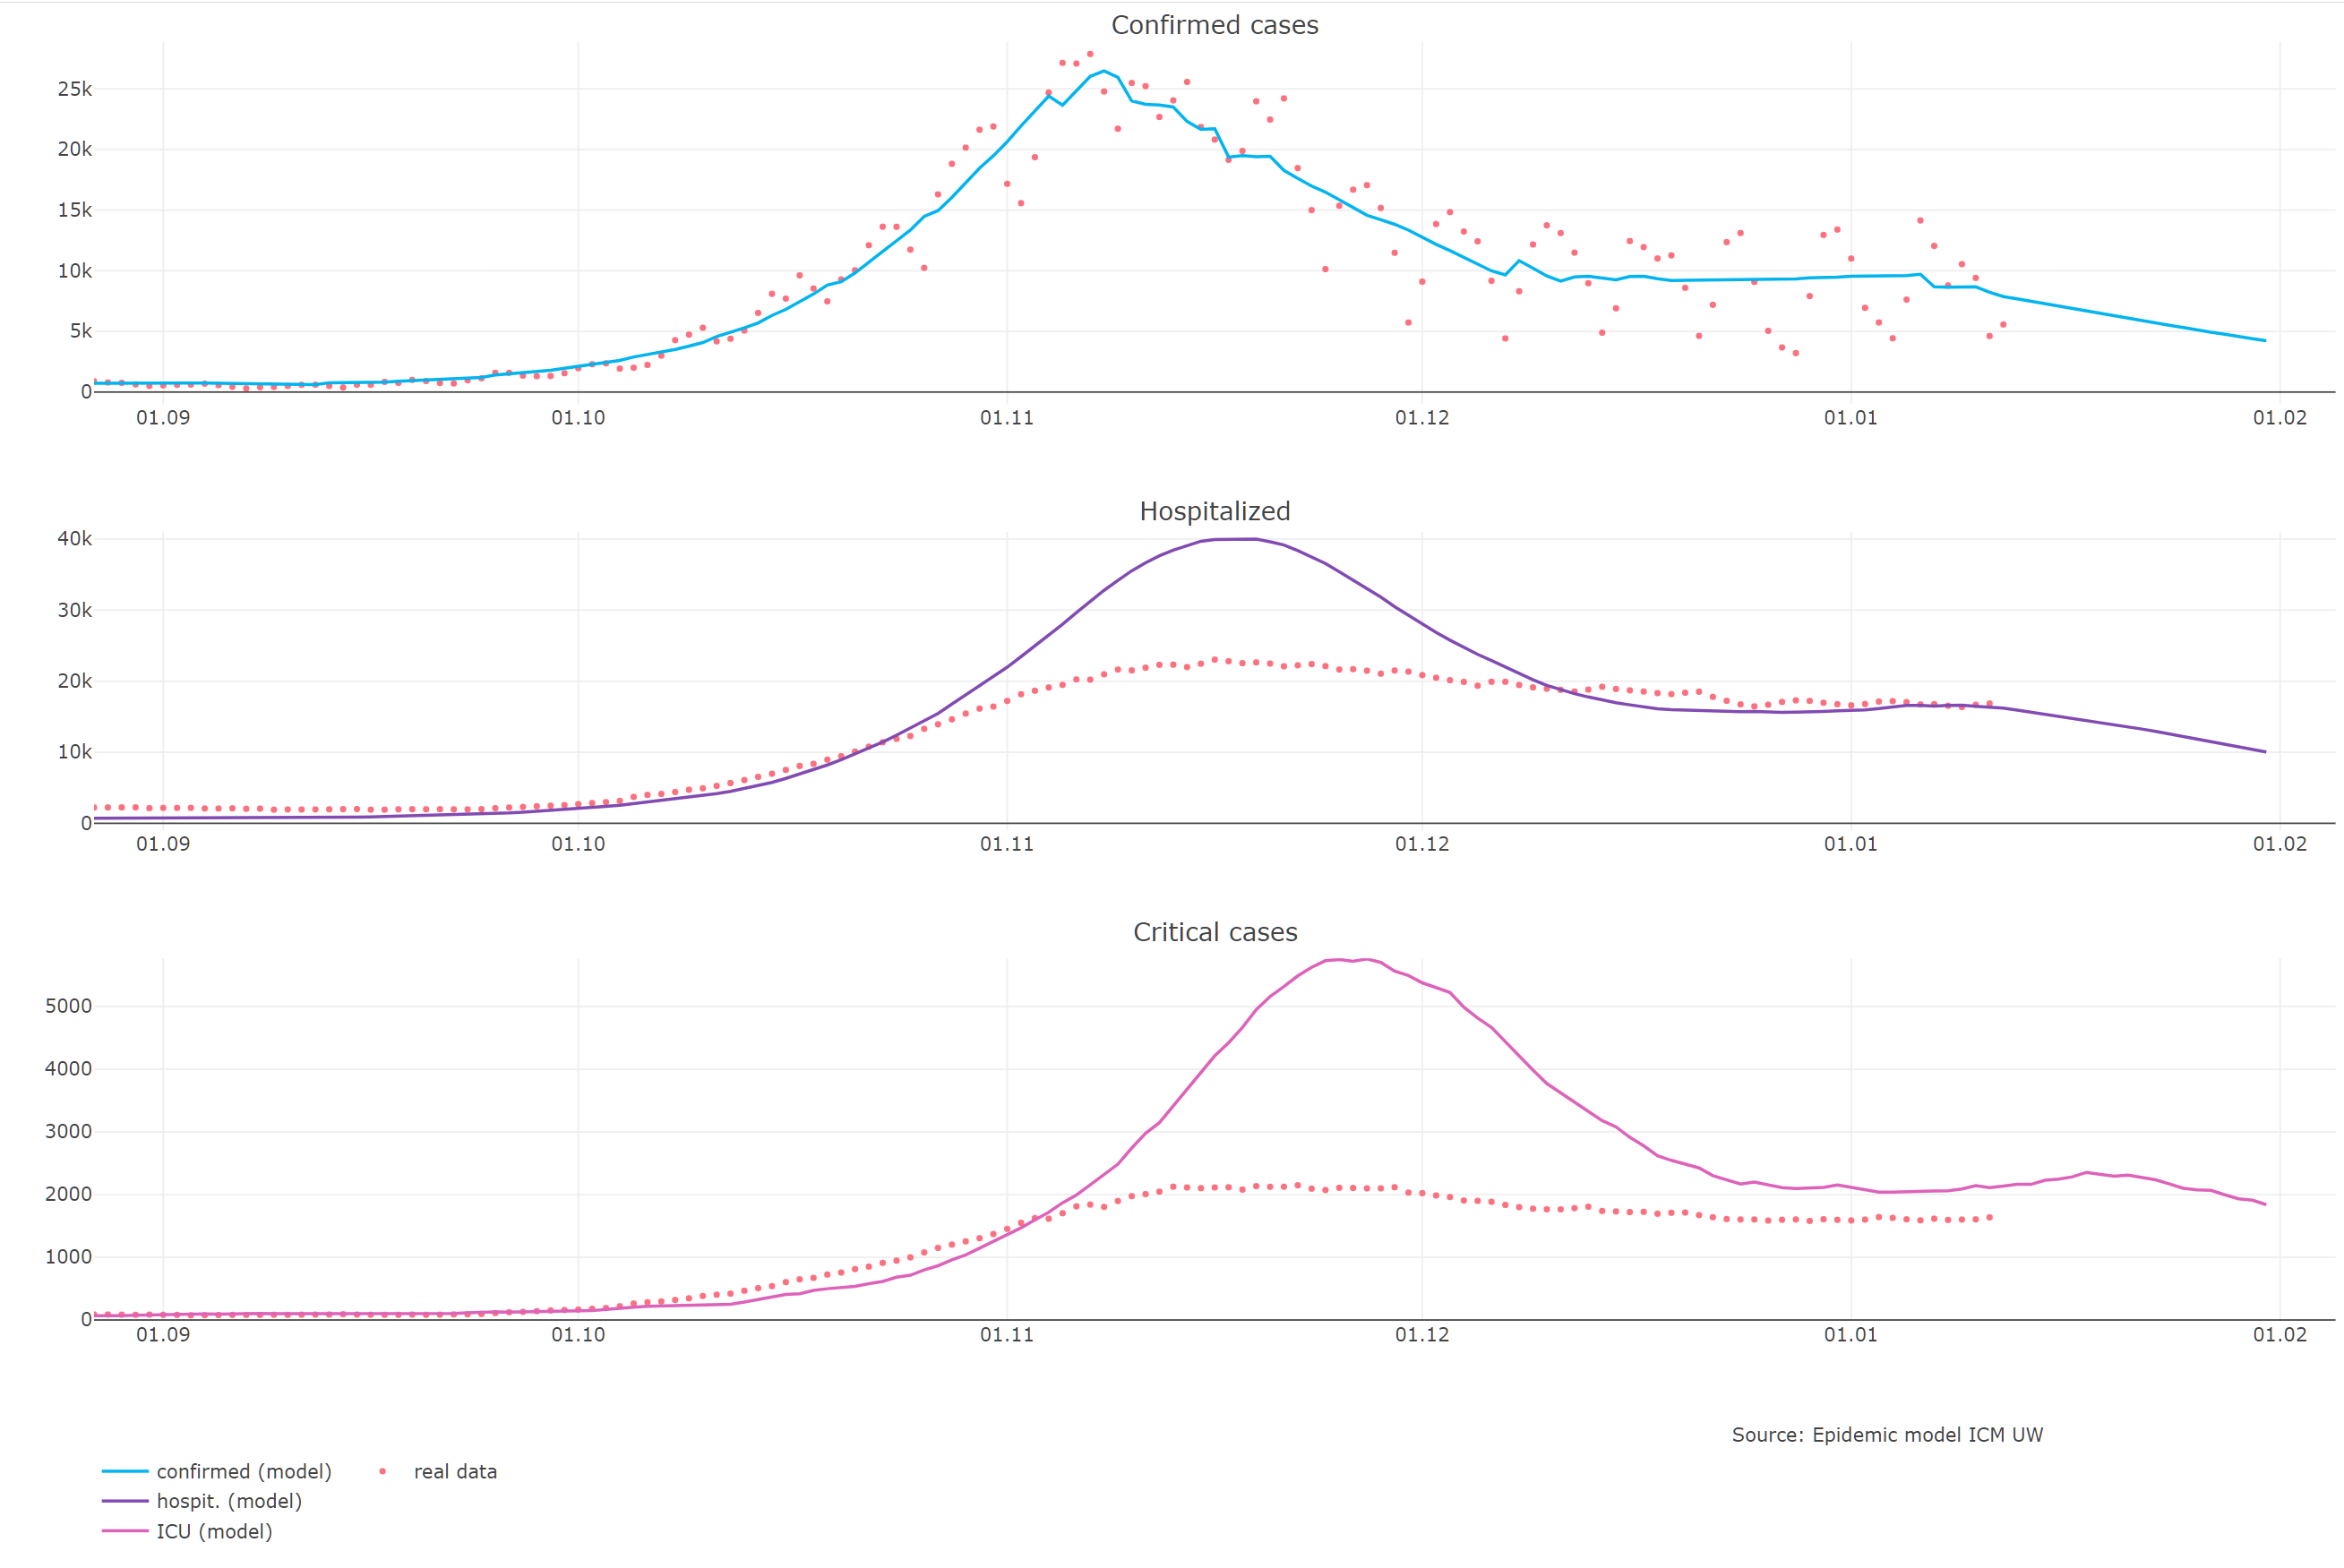
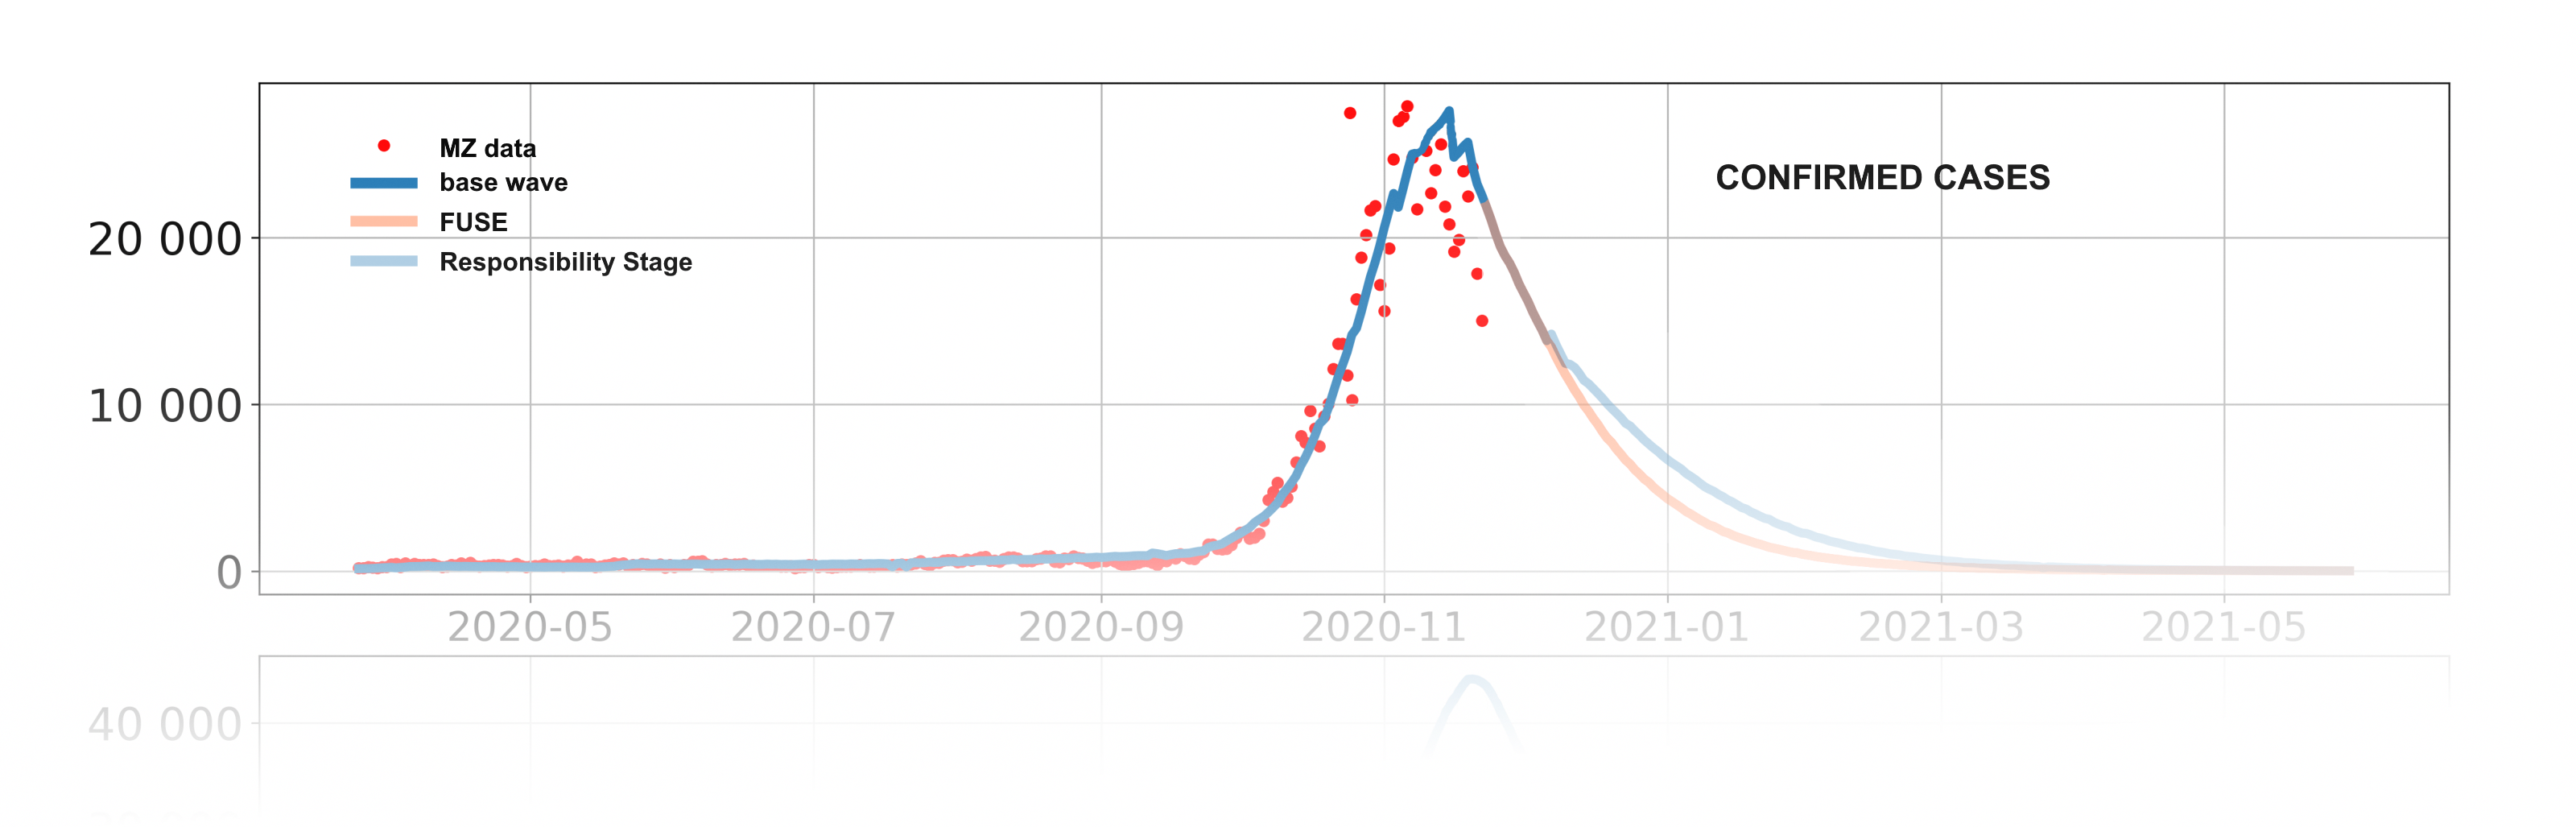
Dynamic chart of identified cases of Covid-19 infection in the period from 03/16/2020 with a prediction to 01/31/2021.
Chart prepared on the basis of the forecast of November 23, 2020.
Below we present a forecast of the spreading of the COVID-19 epidemic in Poland. The forecast results from simulations conducted with the use of the ICM UW epidemiological model. The simulations have been running since the beginning of the pandemic.
The forecast below is an extension of the previous one from 11/9 (which included the introduction of fuse 11/7). The current forecast includes the next stage (Responsibility Stage), which consists removing some administrative restrictions. The scenario assumes, among others opening of shopping centers and libraries.
The remaining assumptions of the scenario remain unchanged, so the course of the modeled curves does not change until around December 10, when the effects of the Responsibility Stage begin to be visible.
As you can see, the course of the identified cases does not change particularly after the introduction of the next stage – we observe only a slight slowdown in the decrease in the number of cases.
Download full resolution chart.
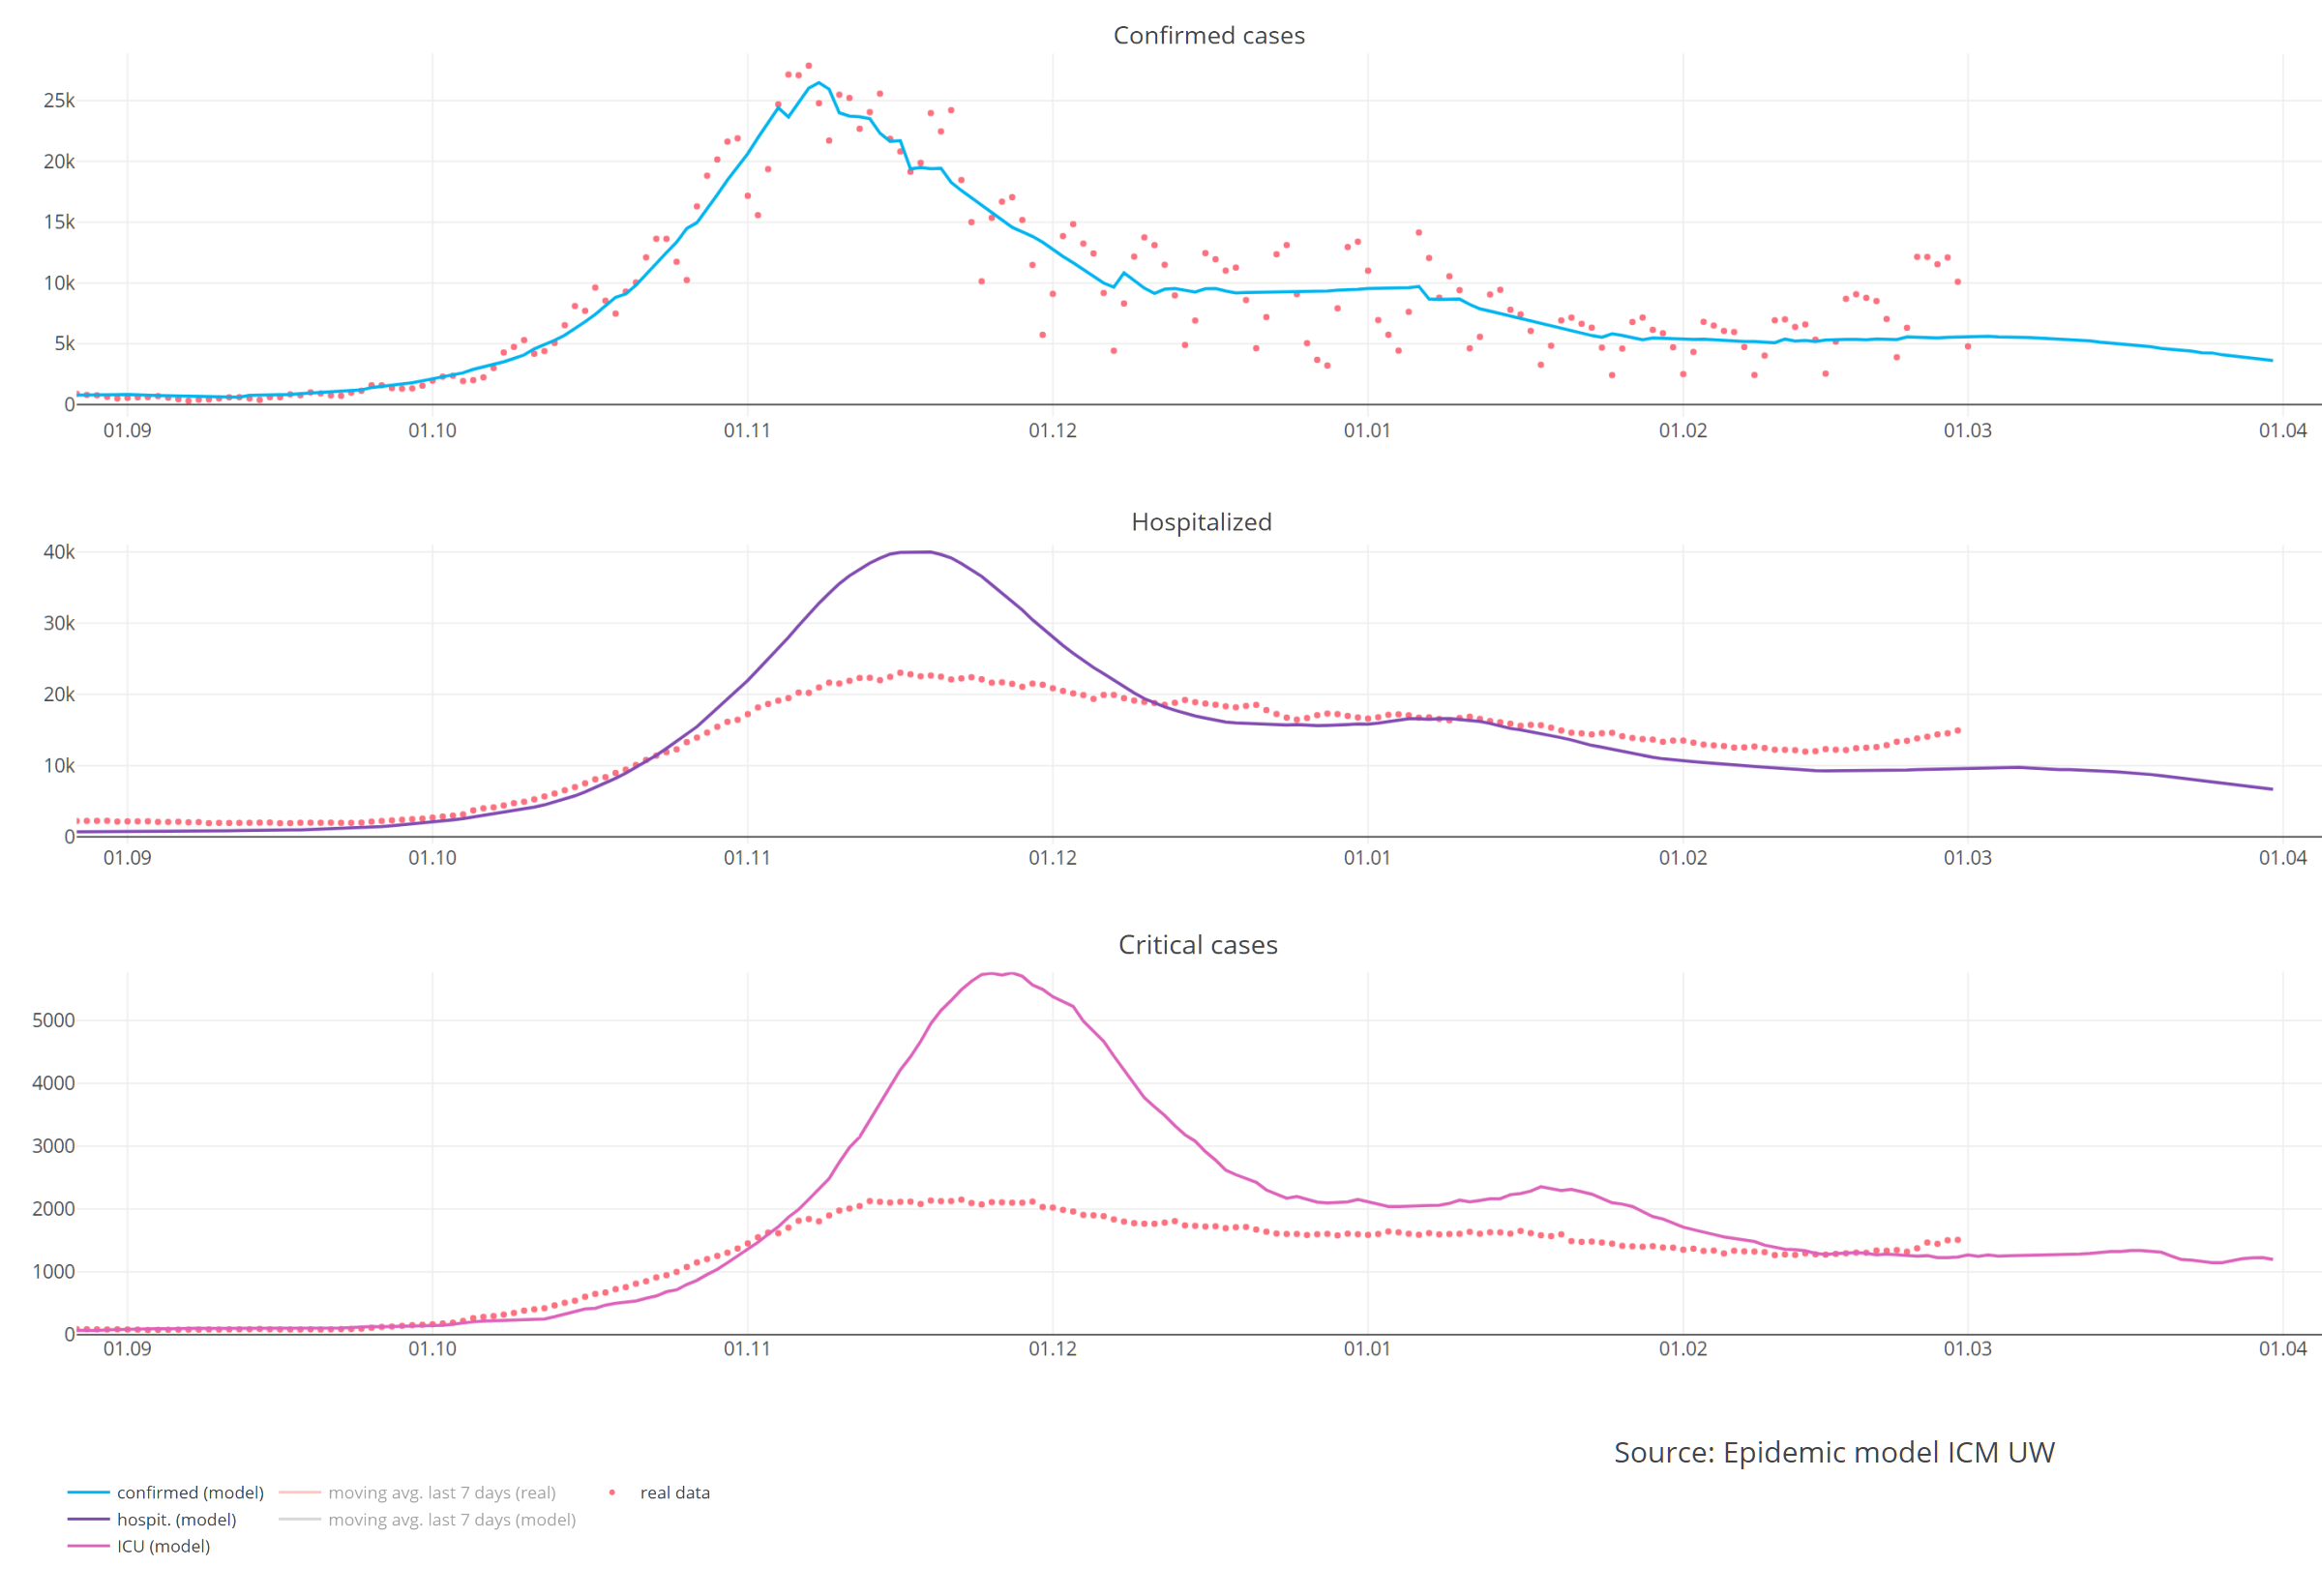
We also present the number of people requiring hospitalization and the use of a respirator. Our forecasts were calibrated to the numbers observed with excess beds and covid respirators. Currently, as you know, these places are managed in a much more economical way – that is why our curves run above the curves of the observed data. This forecast does not include changes to the restrictions planned after November 28 – in a slightly artificial way we assume that the last set of restrictions is the Responsibility Stage and will apply indefinitely, which of course cannot be the case.
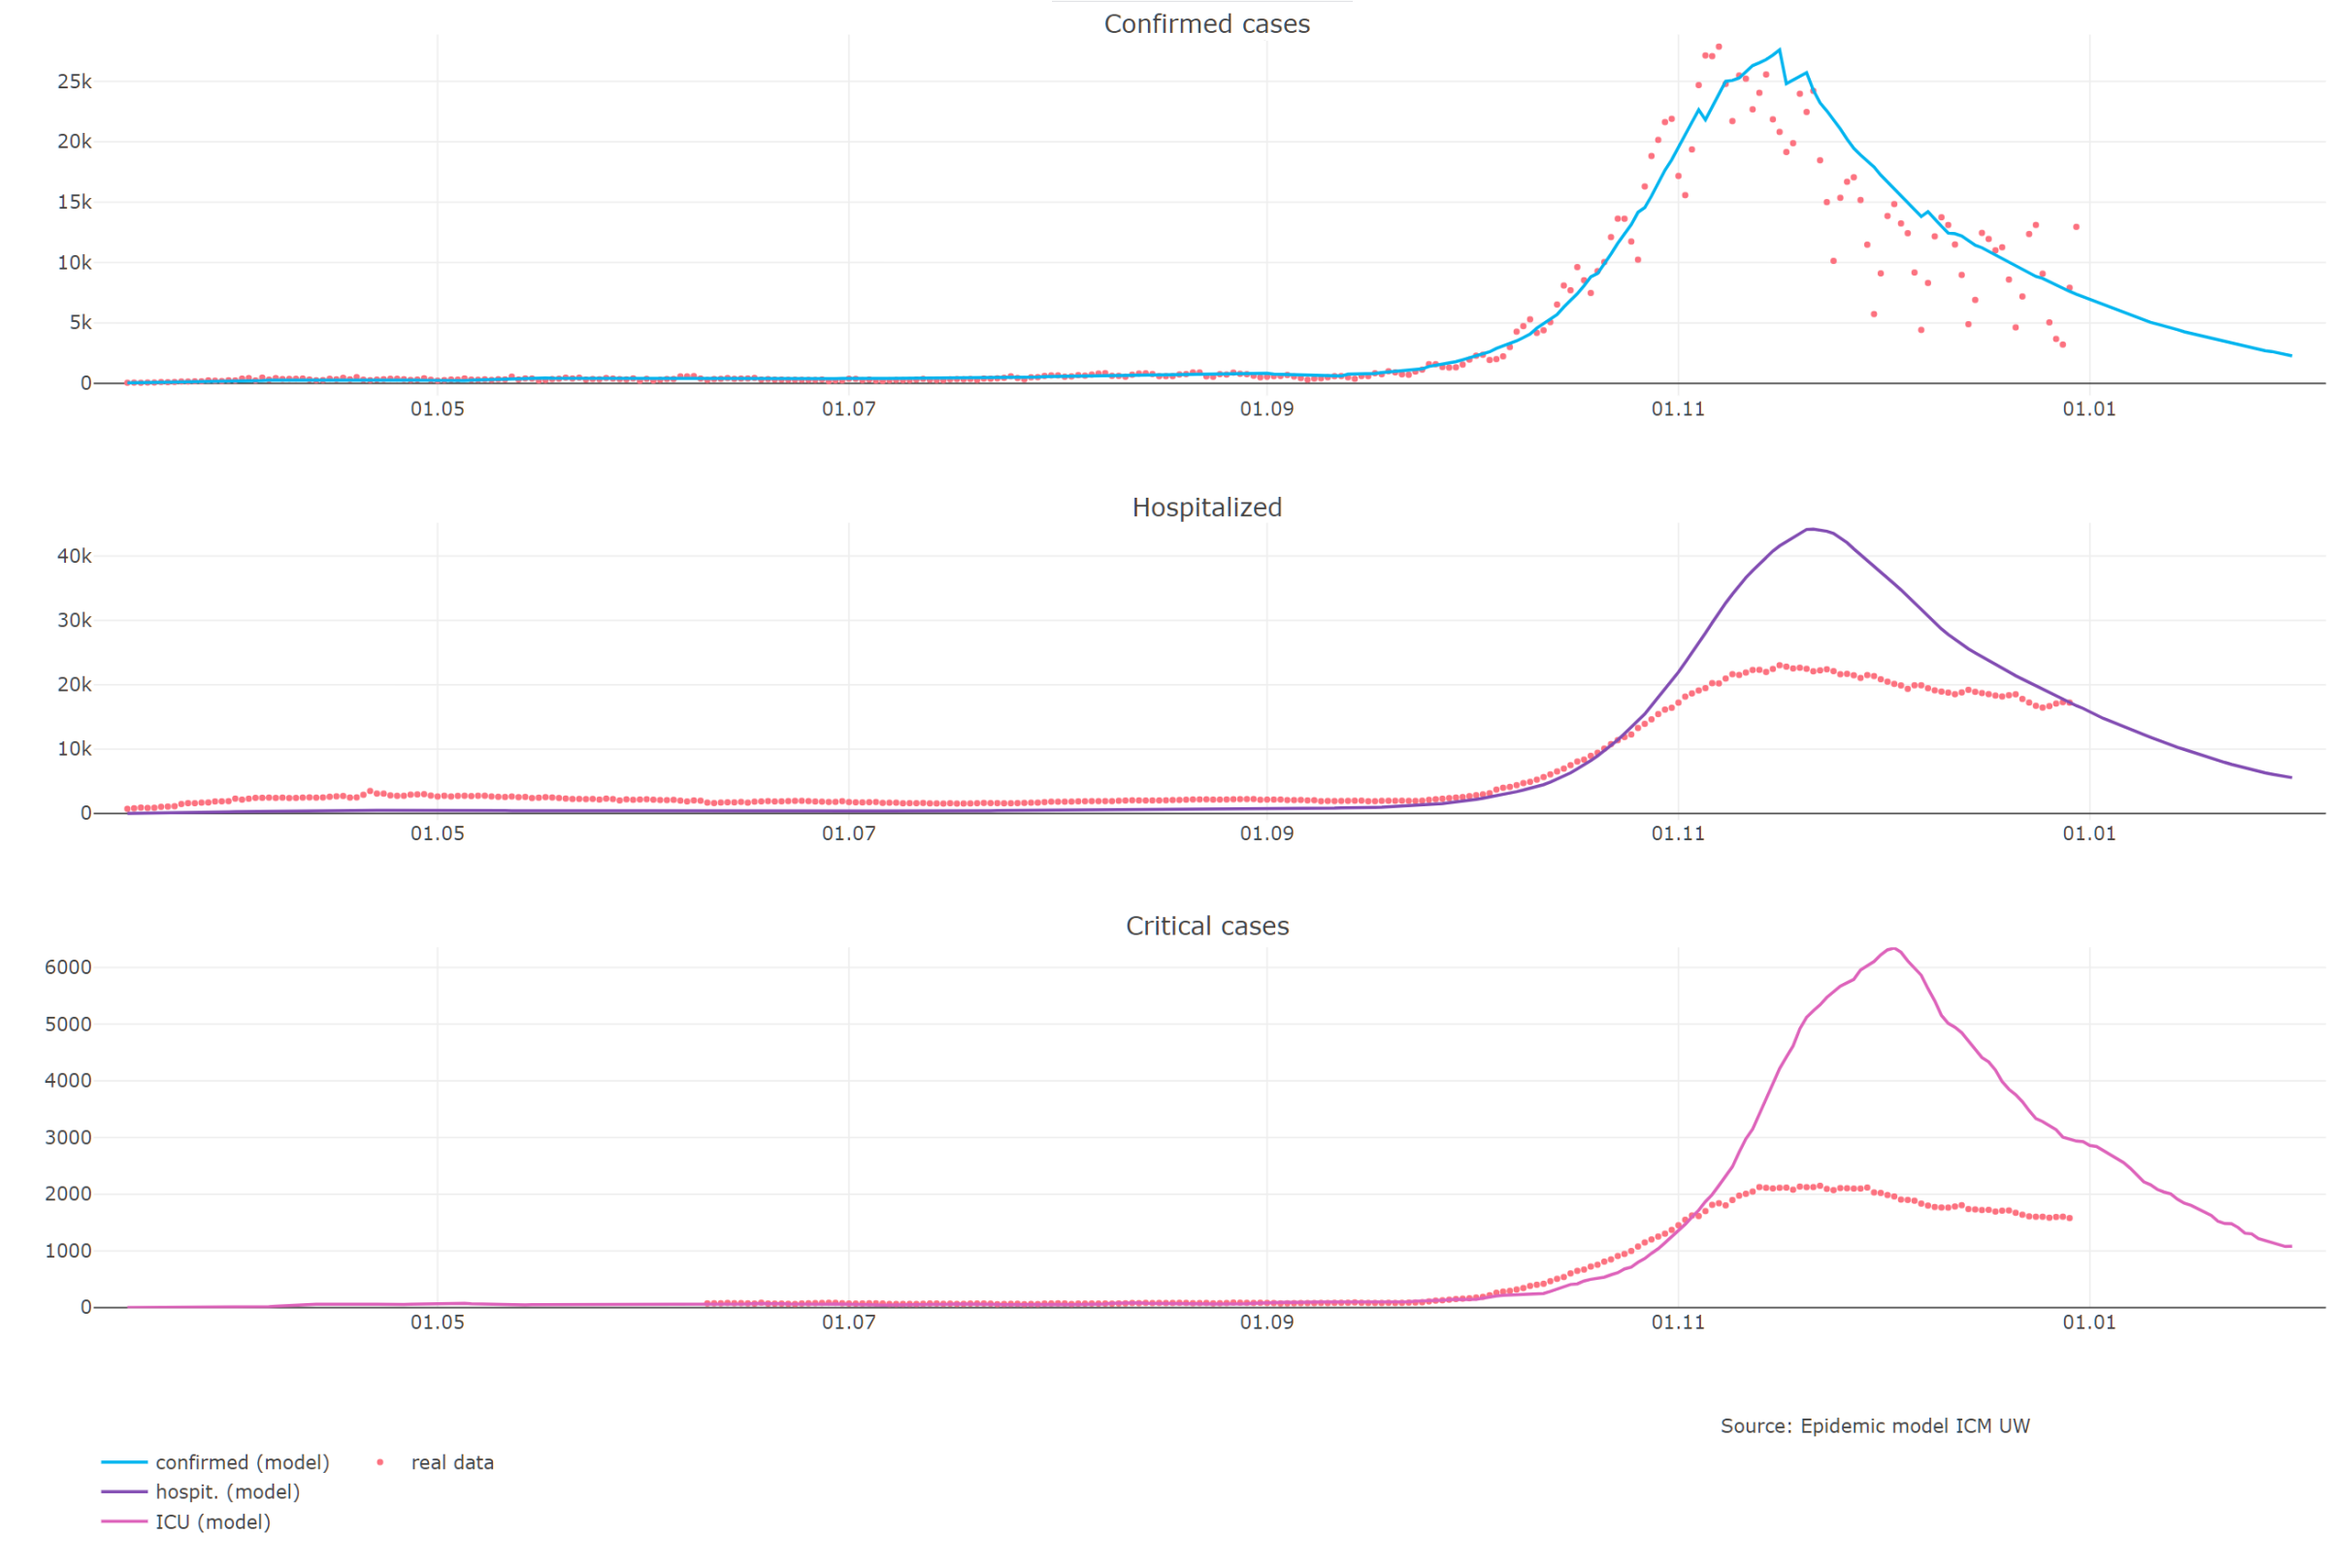
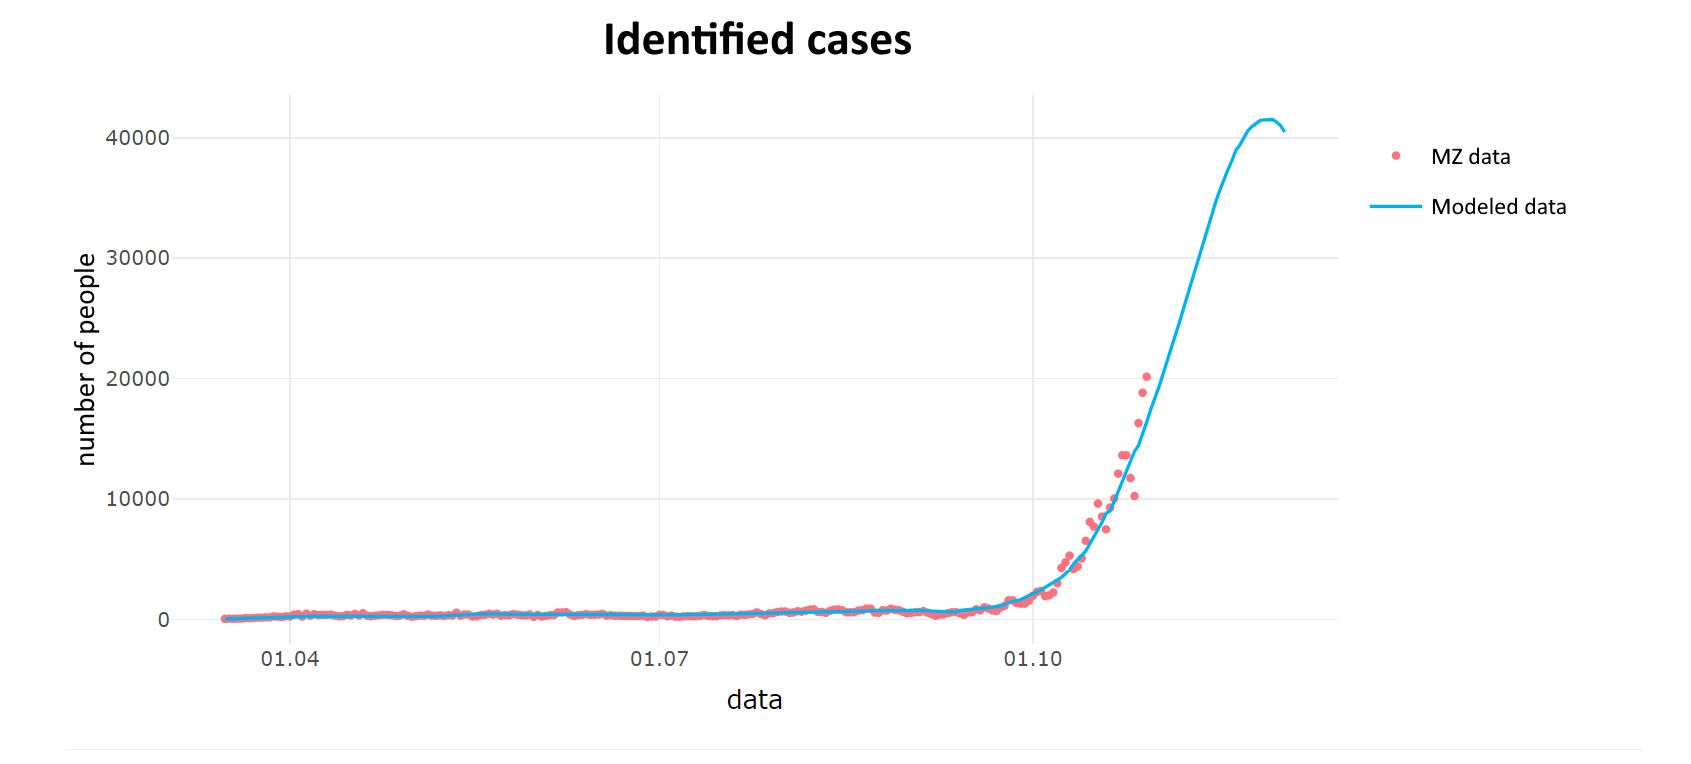
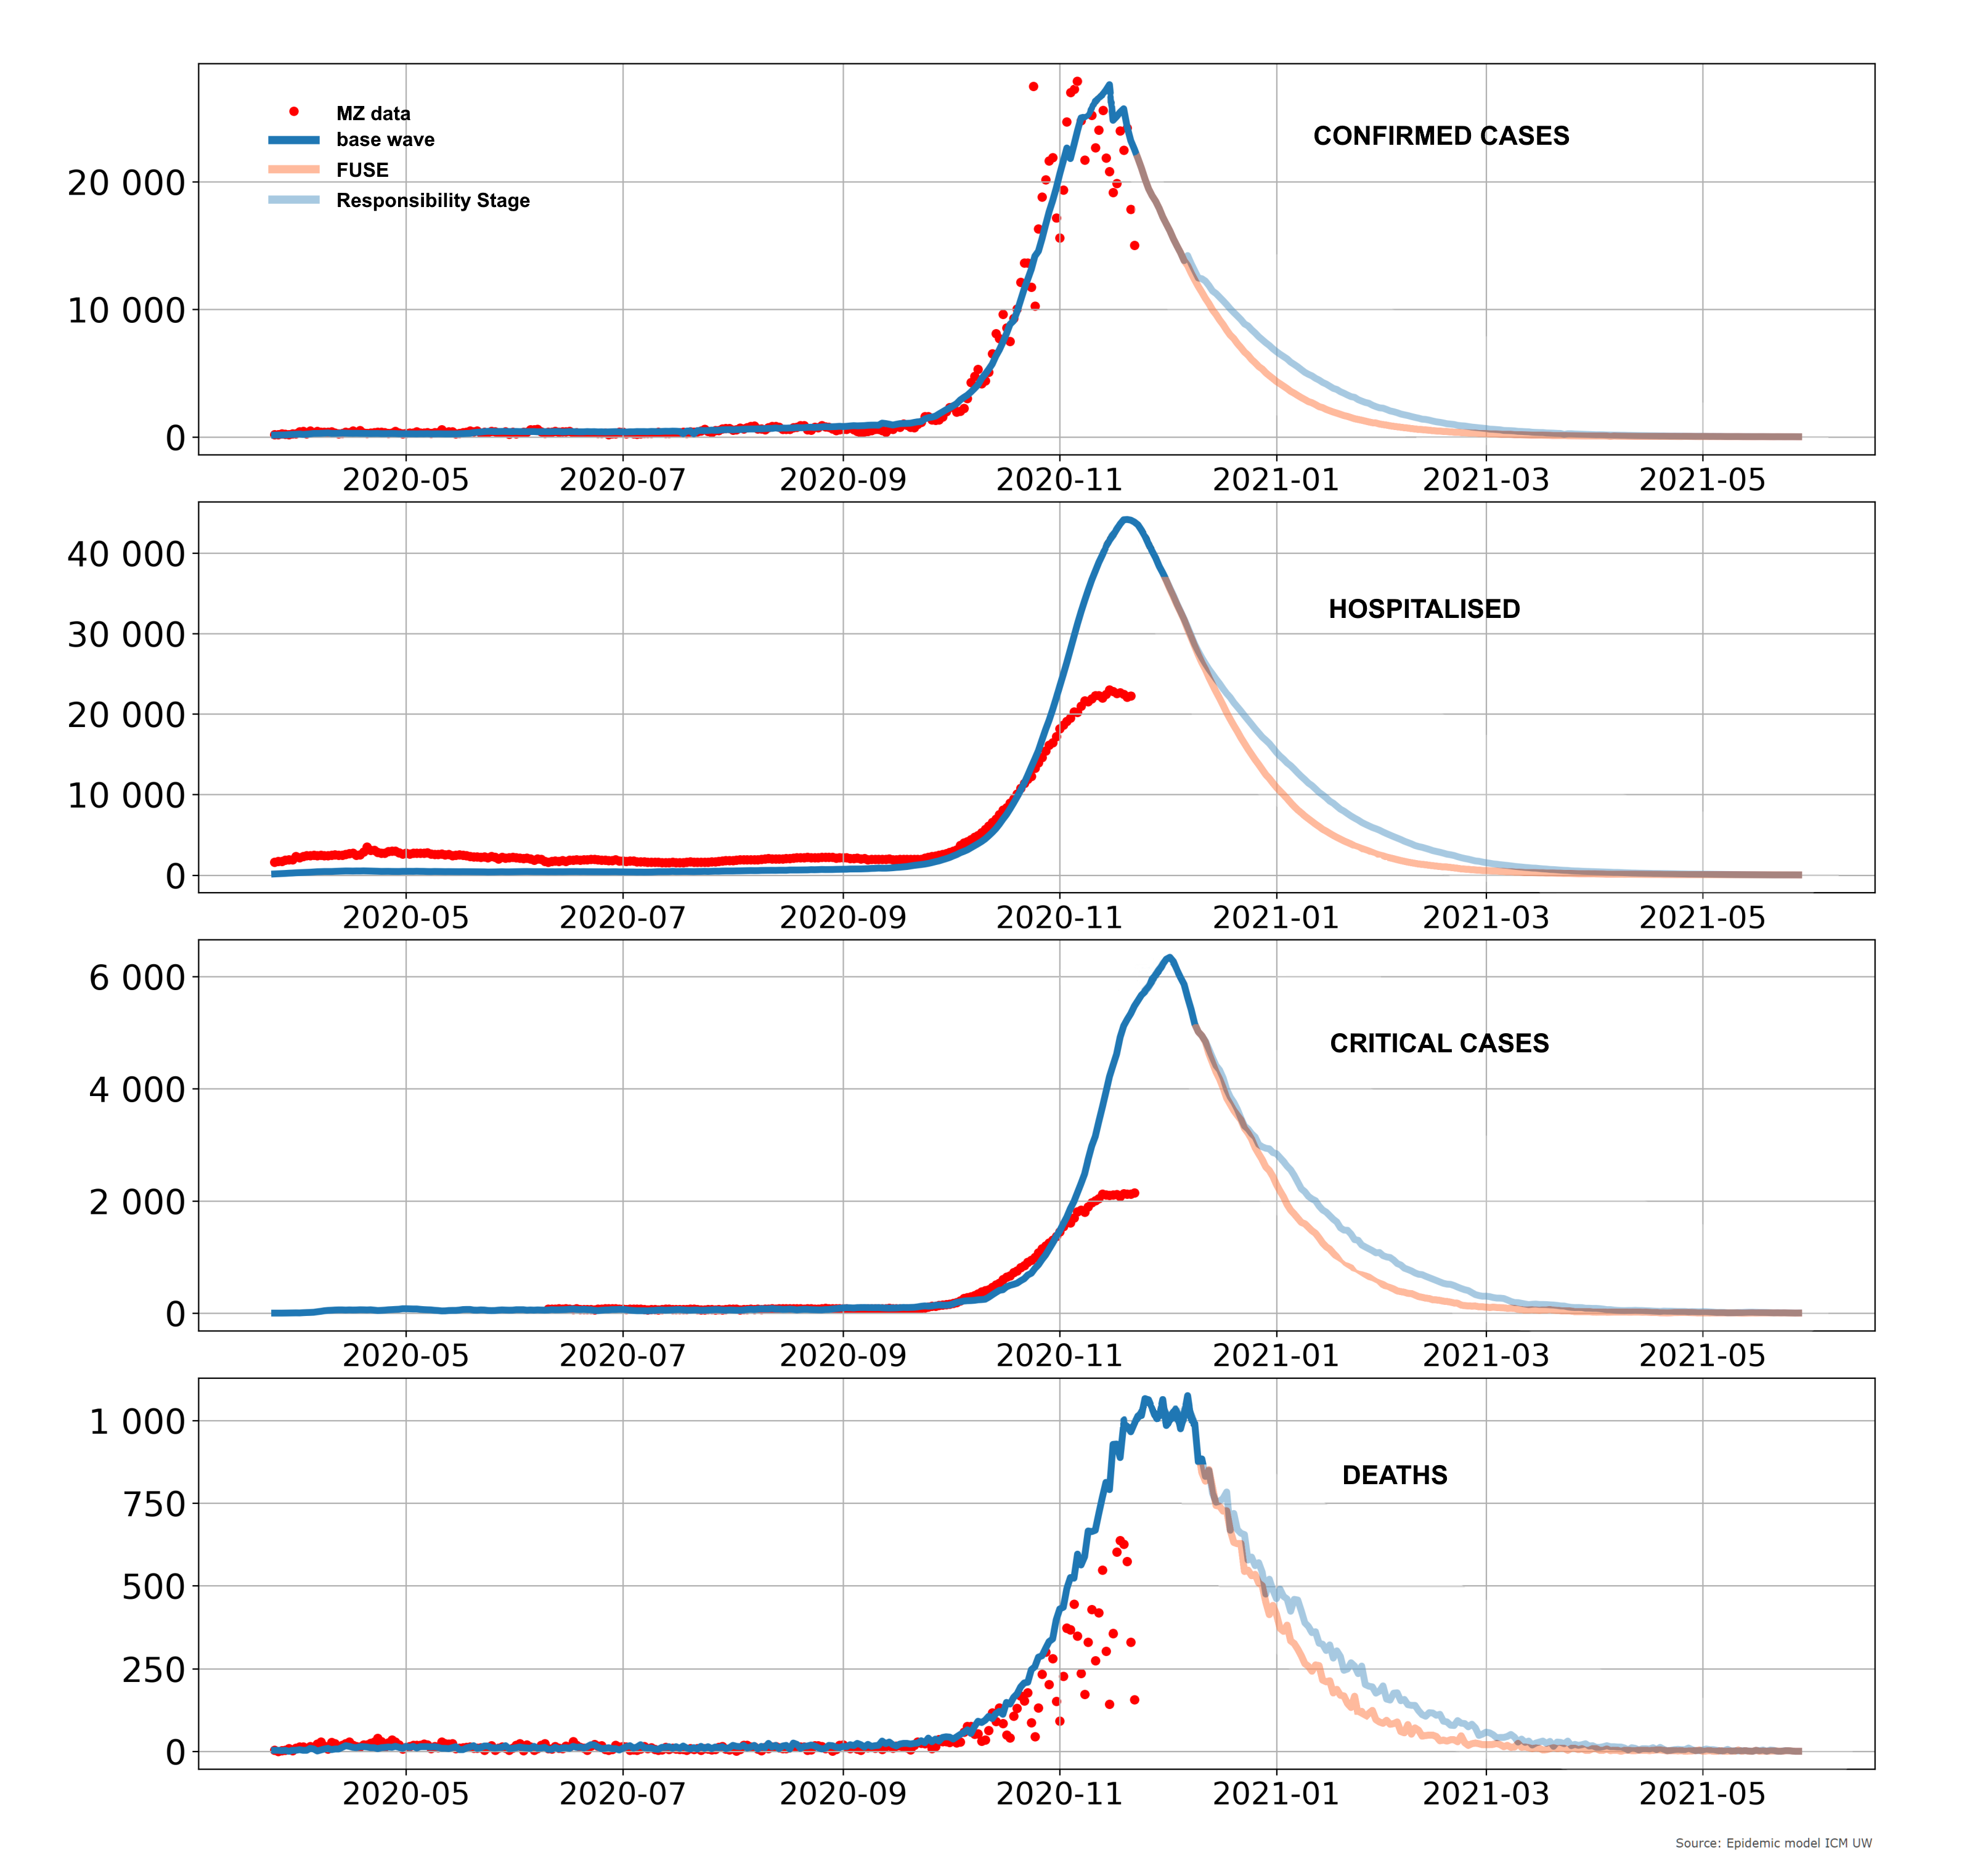
Dynamic chart of identified cases of Covid-19 infection in the period from 03/16/2020 with a prediction to 01/31/2021.
Chart prepared on the basis of the forecast of 11/09/2020
Below we present a forecast of the COVID-19 epidemic spread in Poland. The forecast results from simulations conducted with the use of the ICM UW epidemiological model. The simulations have been running since the beginning of the pandemic.
After a long period of stabilization in the number of new cases, there were significant increases in September and October. According to our model, one of the main factors behind these increases is the return of children and young people to school. The number of cases found in schools does not have to be large, but schools have a great potential to drive an epidemic due to their strong networking, i.e. connecting groups of people who are normally relatively separated – families and circles of friends. After the strong increase of daily new cases observed mainly in the first half of October, the government decides to introduce the first serious restriction: the yellow zone implemented in the whole country. This restriction was introduced on October 17, but its effects in the form of a slight deviation of the curve to the right are only visible from October 27. The next restriction is stronger: the red zone and online learning above third class of primary school. As a consequence, we observe a slow flattening of the curve, which starts on November 5-6. We hope that a significant reduction in the accrual of the number of confirmed cases will prevent us from reaching the threshold of introducing a national quarantine. Our model shows that the seven-day moving average on November 17 is just above the lower quarantine threshold, but is about to start dropping sharply. This is a consequence of introducing restrictions called a “circuit breaker”, which will begin to influence the observed data on November 17th. We hope that this is how the situation develops. However, administrative considerations, in particular the system and quantity of testing, may also affect the numbers of cases identified. From a few days the statistics include antigen tests, which are much cheaper than PCR tests, and their results may “artificially” inflate the readings of the number of cases.
We also present the number of people requiring hospitalization and the use of a respirator. Our forecasts were calibrated to the numbers observed when the buffer of available beds and covid respirators was much larger than today. Currently, as you know, these places are managed in a much more economical way – that is why our curves run above the curves of the observed data. This forecast does not include planned unfreezing – in a slightly artificial way, we assume that the last set of restrictions – the “circuit breaker” – will remain in force indefinitely, which of course cannot take place. Soon we will change our forecast, taking into account the dates and ways of introducing restriction easing
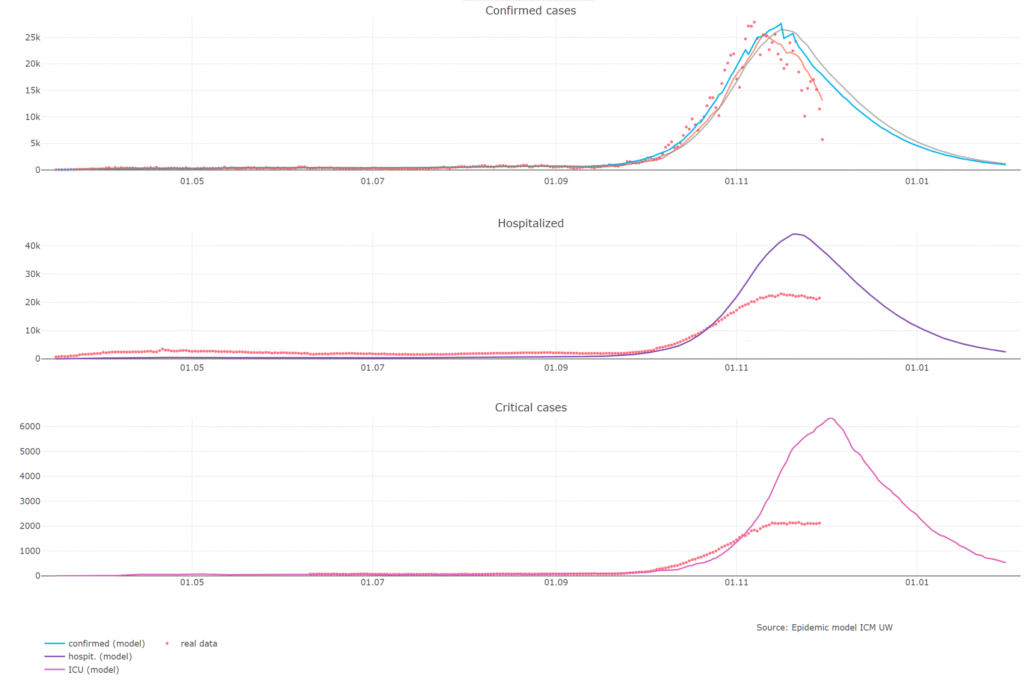
Chart of identified cases of Covid-19 infection in the period from 03/16/2020 with a prediction to 01/31/2021.
The forecast covered the number of diagnosed cases of disease in two variants of transmission in public places.
ICM’s announcement of 3 November 2020 in connection with media information regarding the impact of the ongoing protests on the spreading of the COVID-19 epidemic
In connection with the media information on the impact of the ongoing protests on the spreading of the COVID-19 epidemic, the epidemiological modeling team of the Interdisciplinary Center for Mathematical and Computational Modeling of the University of Warsaw informs that the simulations assume two levels of effectiveness of introducing yellow and red zones throughout the country, which affects the predicted number of identified cases. At the current stage of model development, we are not methodologically prepared to responsibly account for this type of assembly as a separate factor. Therefore, it is not legitimate to say that the ICM UW model shows that street protests may increase the number of identified cases from 25 thousand to 31 thousand.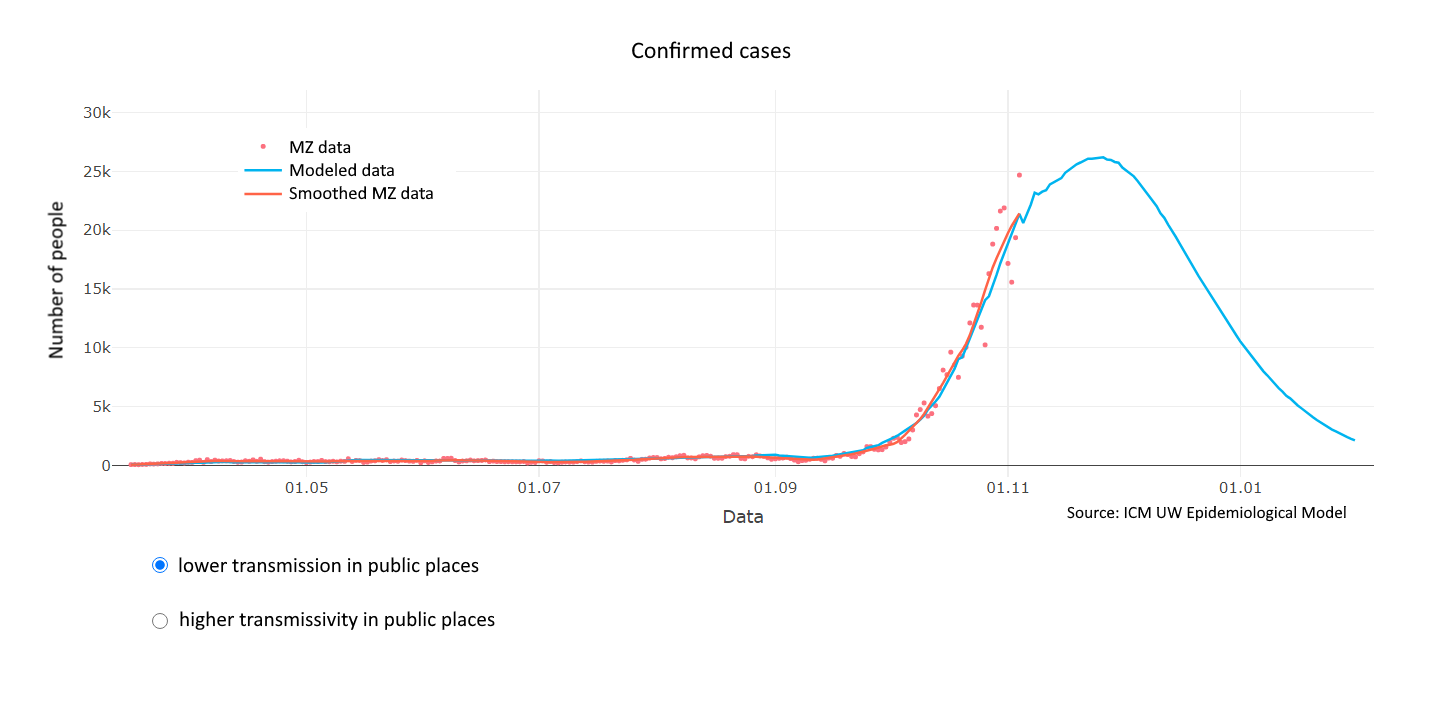
Download the chart in full reslution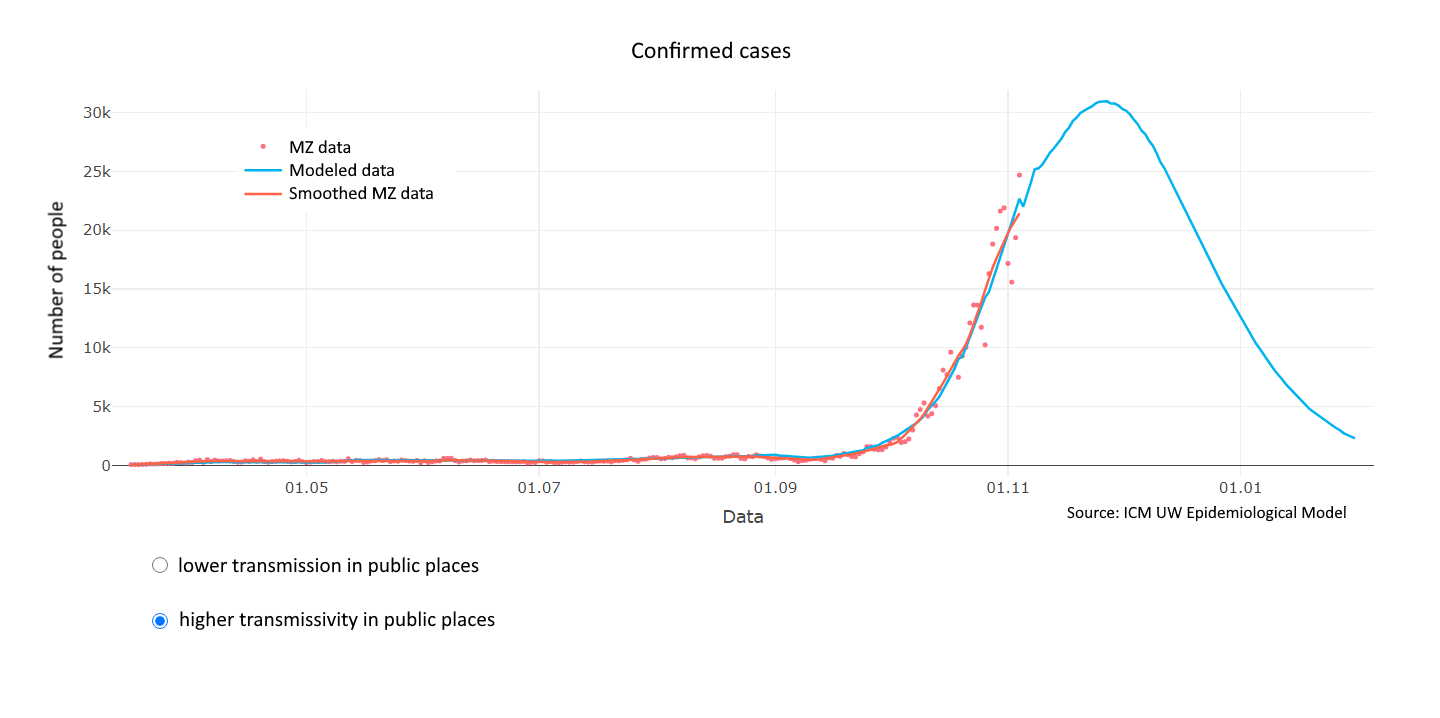
Download the chart in full resolution
Wykres stwierdzonych przypadków zakażenia Covid-19 w okresie od 16.03.2020 z predykcją do 02.12.2020.
Wykres stwierdzonych przypadków zakażenia Covid-19 w okresie od 16.03.2020 z predykcją do 31.10.2020.
Prognoza obejmowała ilość stwierdzonych przypadków zachorowań w dwóch wariantach transmisyjności w szkołach (odpowiednio 40% i 30%)
