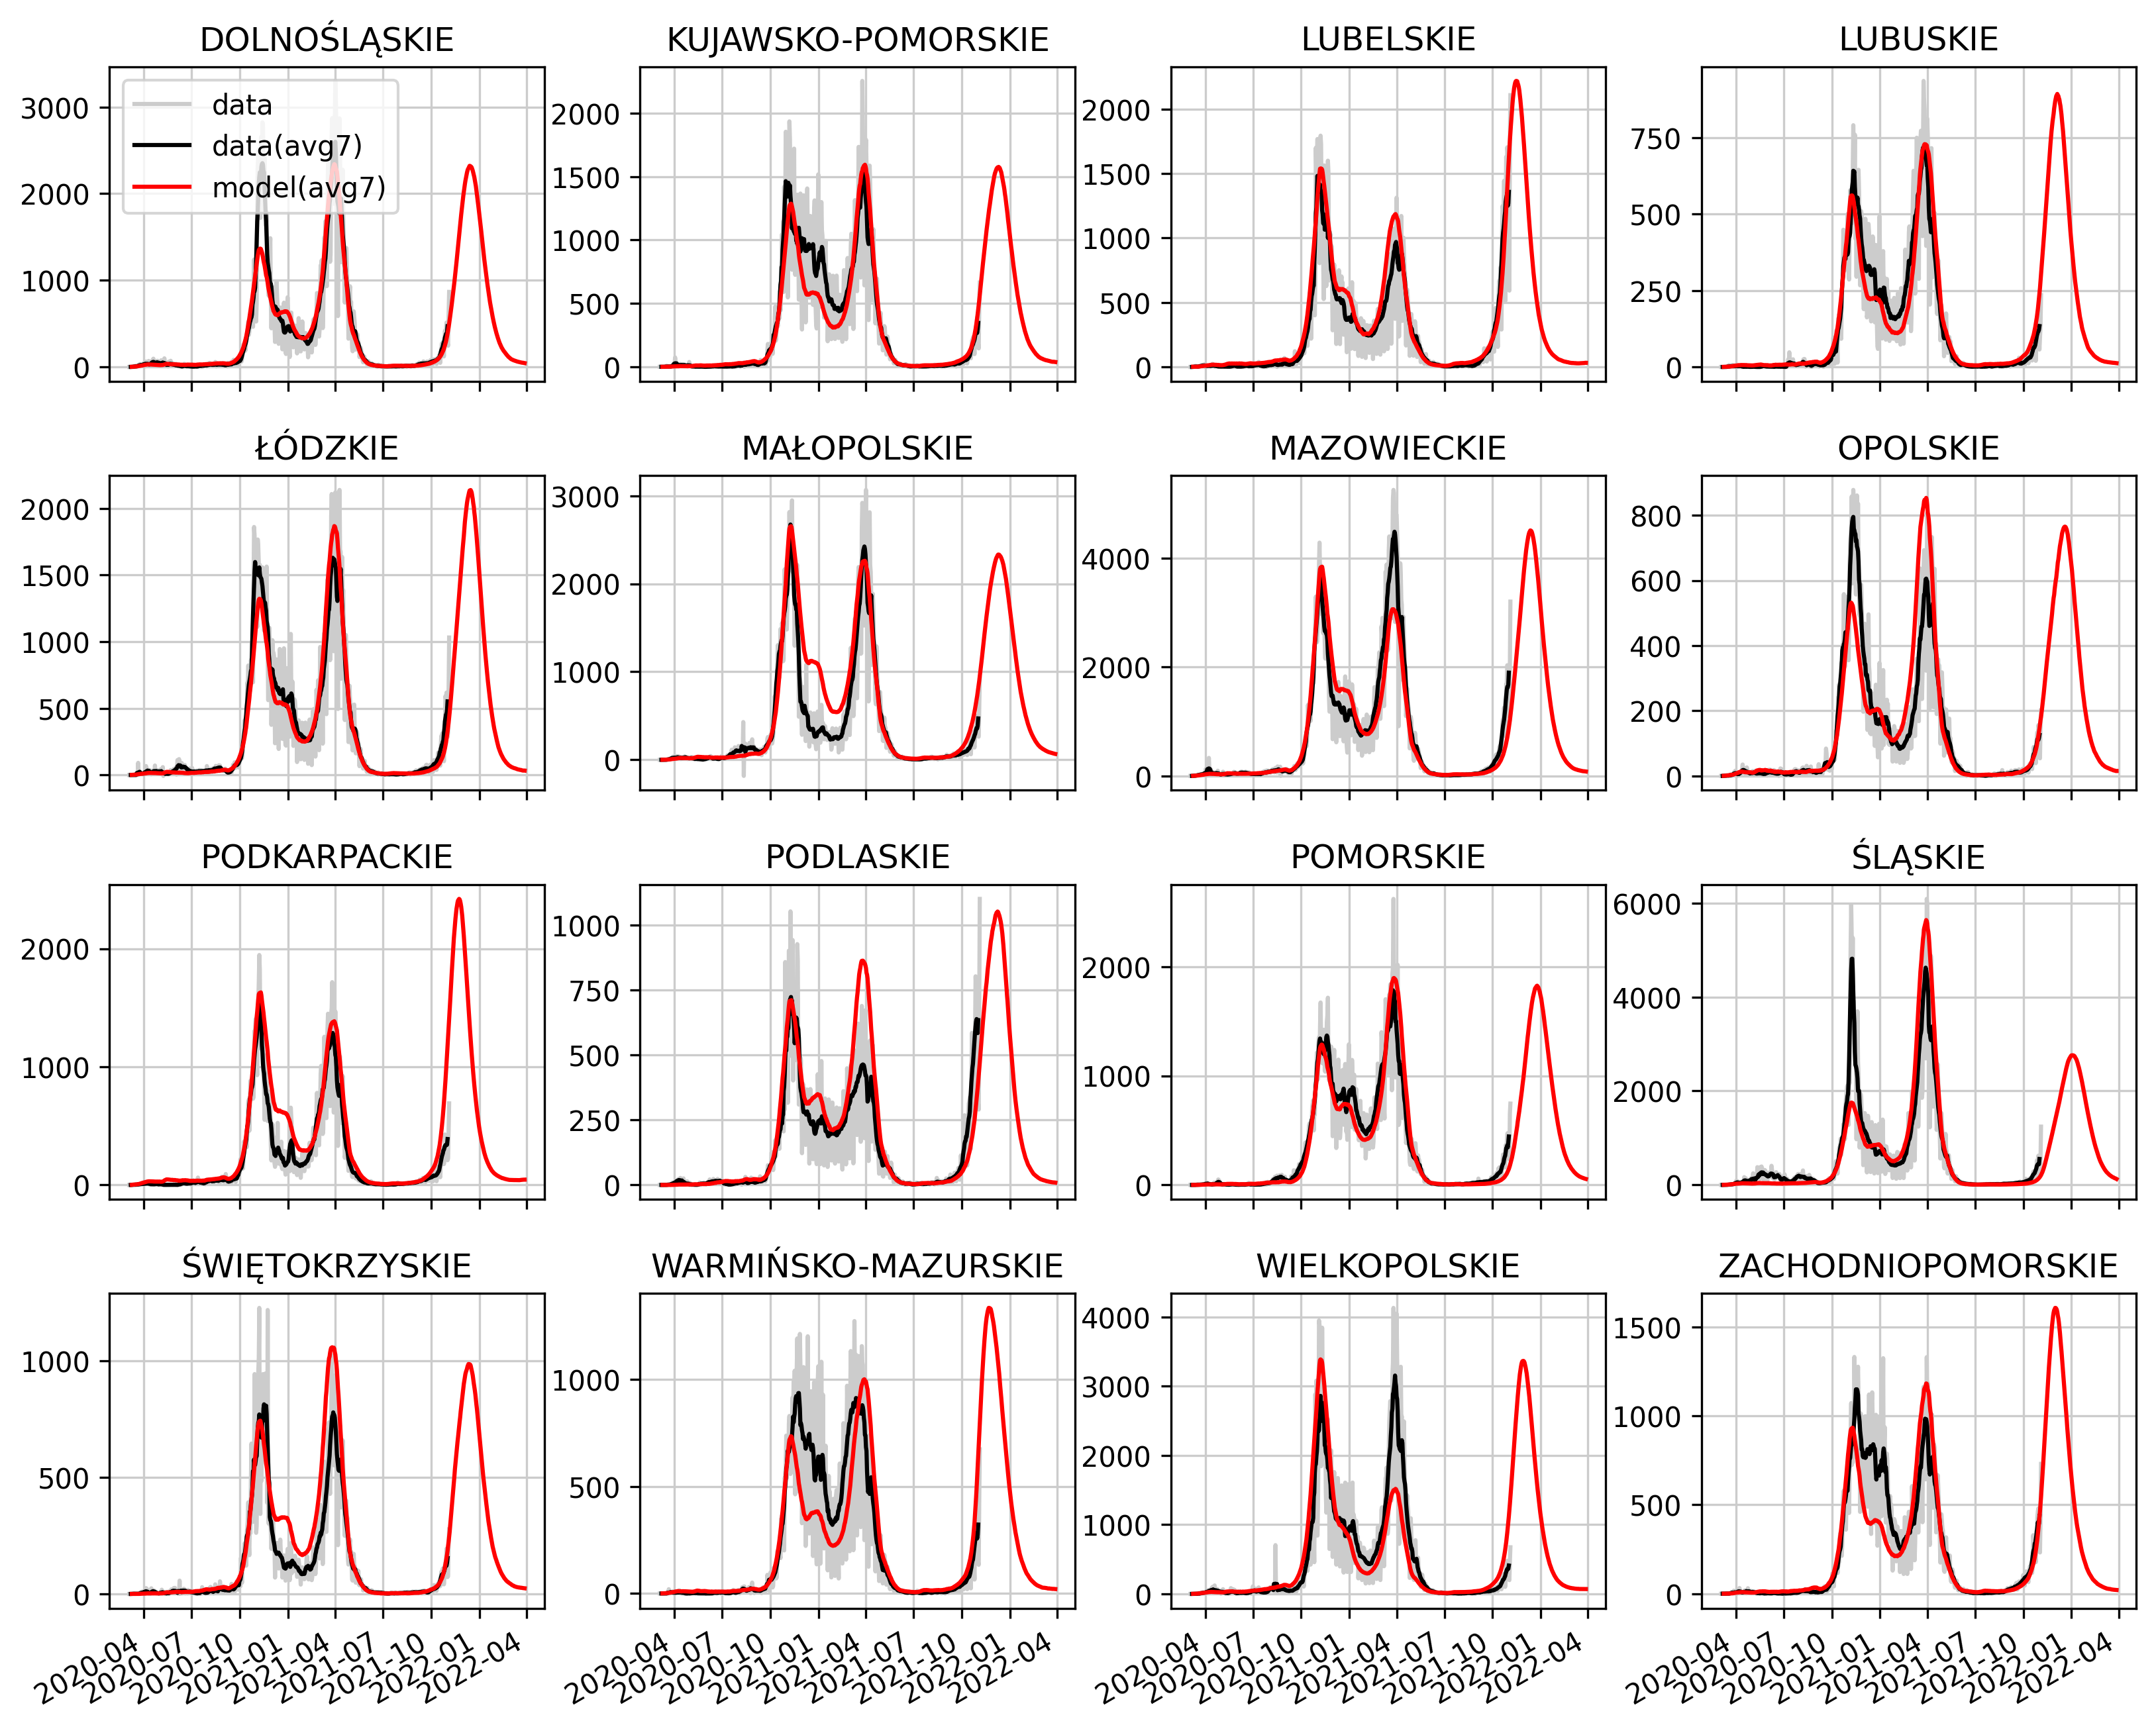
We present the graphs showing the number of confirmed cases of Covid-19 infection in the voivodeship resolution.
Category: Analyzes and scenarios
We present a variant forecast for the spreading of the epidemic in autumn 2021. This is a test forecast, taking into account the risk of reinfection and partial cross-resistance between the Alpha and Delta variants.
General informations about forecast
• The forecast variants assume two levels of population immunization (lower and higher) – the percentage of convalescents in the population on June 1, 2021 is approx. 45% or 57%, respectively.
• The forecasts take into account all historically introduced restrictions and easing, including the holiday period (school closings and increased travel) and assume administrative restrictions and the intensity of social contacts in the post-holiday period, analogous to September 2020.
• We assume the participation of the Delta variant in new infections on June 1 at the level of 6%.
• Vaccinations are implemented according to data provided by ECDC and take into account vaccinations for which the first dose was administered until August 14, 2021.
Main assumptions about the risk of reinfection
We assume that the level of immunity, understood as the percentage reduction in the daily probability of being infected for the second time with the same variant, is 100% for the first month after recovery and then slowly decreases linearly at a rate of 5% of the initial value per month.
We assume that the level of cross-resistance when exposed to the Delta variant after an outbreak of the wild or Alpha variant is initially 87.5%, 95% or 97.5%. This cross-resistance persists for one month after recovery and then slowly declines linearly at a rate of 5% of the starting value per month to an arbitrarily defined level.
High immunization:
Download the full resolution chart
Low immunization:
Download the full resolution chart.
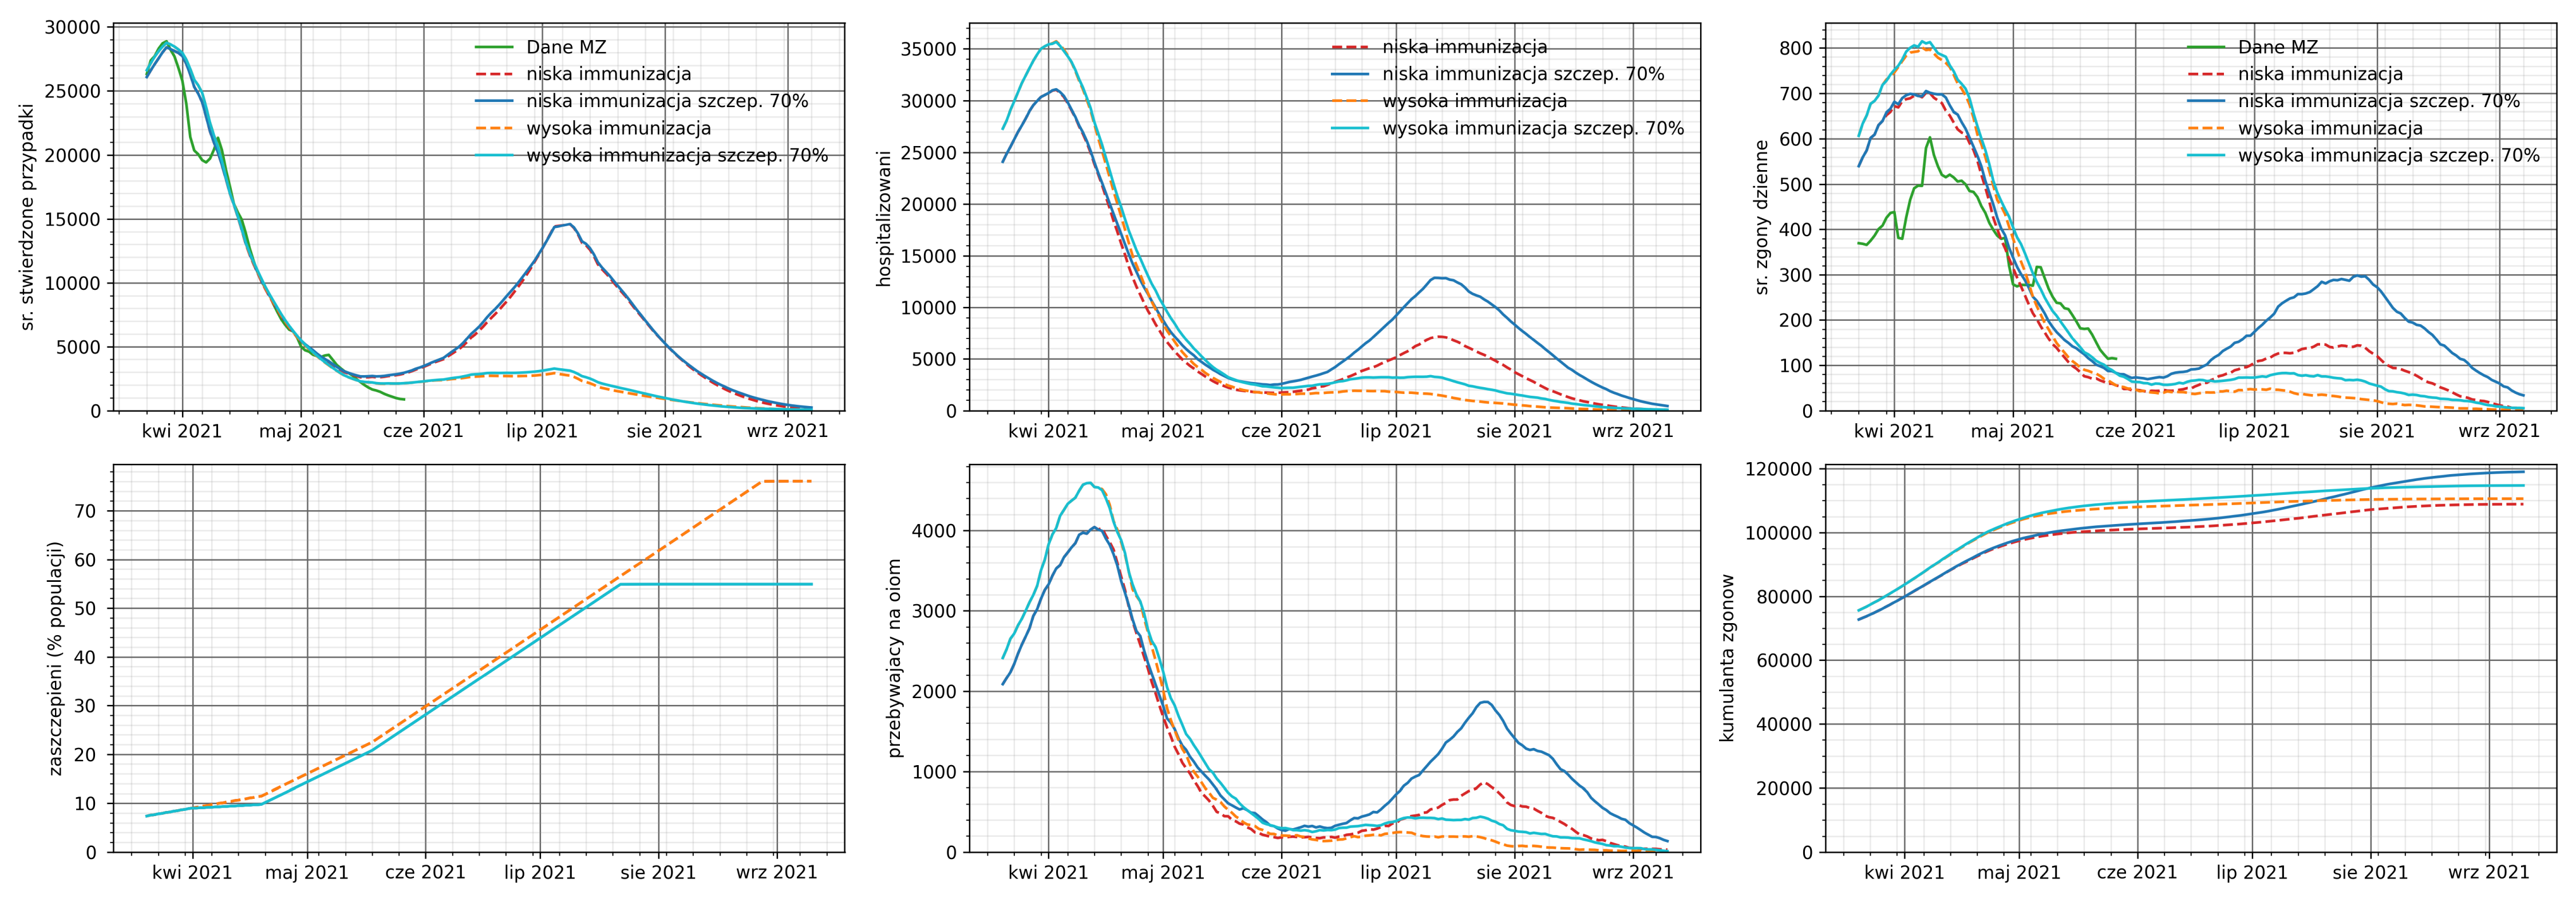
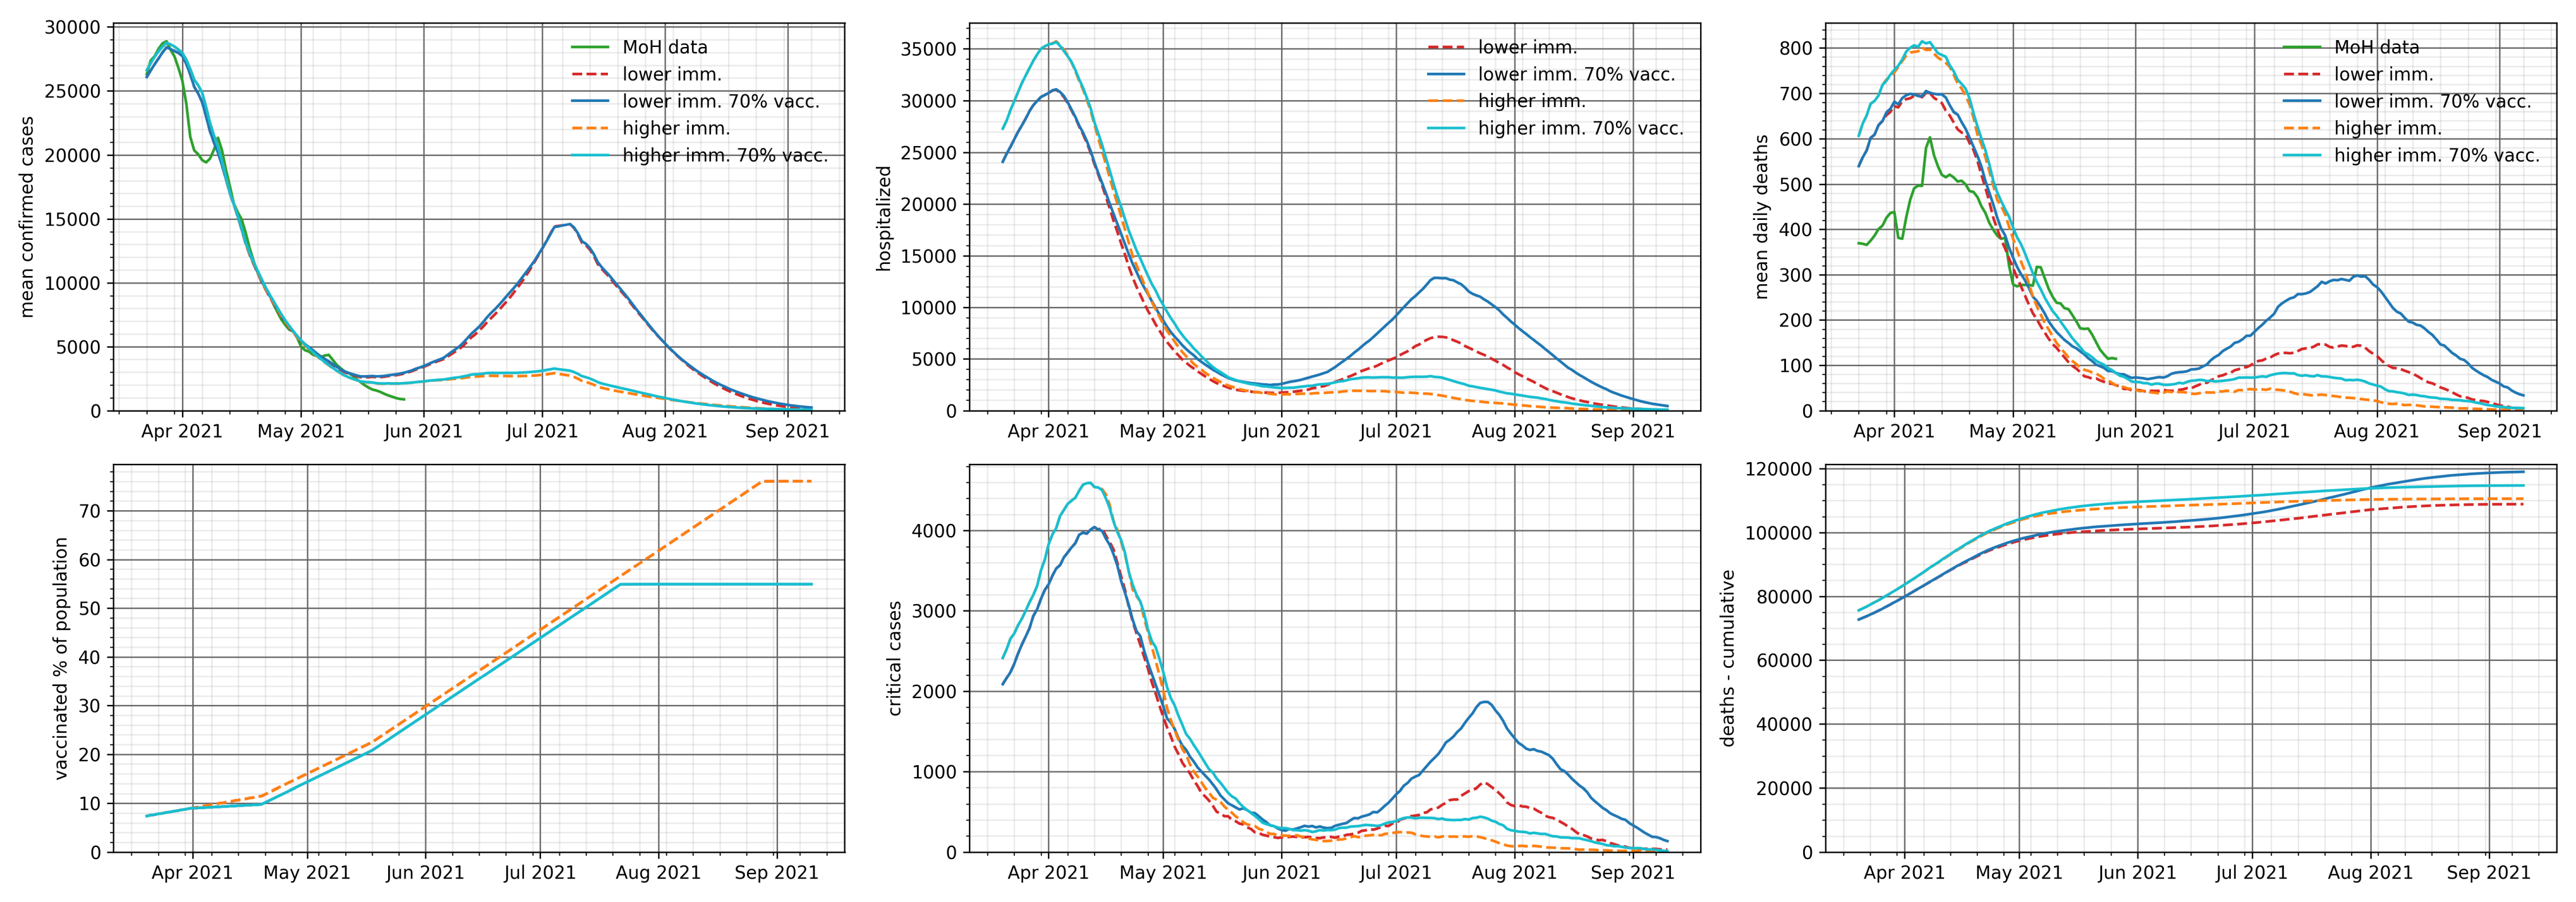
We present a variant forecast for spreading of the epidemic by the end of August. Due to the fact that the used version of the model does not yet take into account the risk of reinfection, both variants of the forecast assume a lower level of population immunity – the percentage of survivors in the population on June 1 is approximately 45%.
The variants differ in the assumed level of participation of the Delta variant in new infections on June 1.
We assume that each approved age group will no longer get vaccinated once vaccination coverage is reached at 70%. The assumed vaccination efficiency is the same for all variants.
We consider two levels of the Delta variant in new infections on June 1: 3%, 6%.
This translates into the share of the delta variant in mid-July, respectively 60% and 75%.
The relative infectivity of the variant Delta with respect to the variant Alpha is taken as the relative infectivity of the variant Alpha with the wild-type variant.
The virus variants in the model are characterized by relative infectivity. Relative infectivity is understood as a value that describes the biological characteristics of a virus that affect the rate of host cell colonization.
The forecast takes into account all historically introduced restrictions and loosening, including the holiday period (school closings and increased travel).
We present epidemic spreading scenarios for different variants of the population resistance level in the case of the delta variant.
Scenario assumptions:
• Population immunity level – the percentage of recoveries in the population as of June 1 is around 45% or around 57%.
• All scenarios take into account the opening of schools and the almost complete removing of restrictions on September 1. We understand this as a practical lack of administrative restrictions, apart from e.g. wearing face masks in closed rooms and possible hygiene habits acquired by the society during the epidemic.
• We are considering scenarios assuming a different share of the Delta variant in new infections on June 1 (1%, 3%, 6% respectively).
• The relative infectivity of the Delta variant with respect to the variant Alpha is taken as the relative infectivity of the variant Alpha with the wild-type variant.
The virus variants in the model are characterized by relative infectivity. Relative infectivity is a value that describes the biological characteristics of a virus that affects the rate of host cell colonization.
We also assume that each age group approved for vaccination will no longer get vaccinated once the target vaccination coverage is achieved. This assumption results from the fact that not every person in the age group declares the willingness/possibility of being vaccinated. There is an upper limit of 70% for this scenario.
In the model, this limit will be reached in the second half of July 2021.
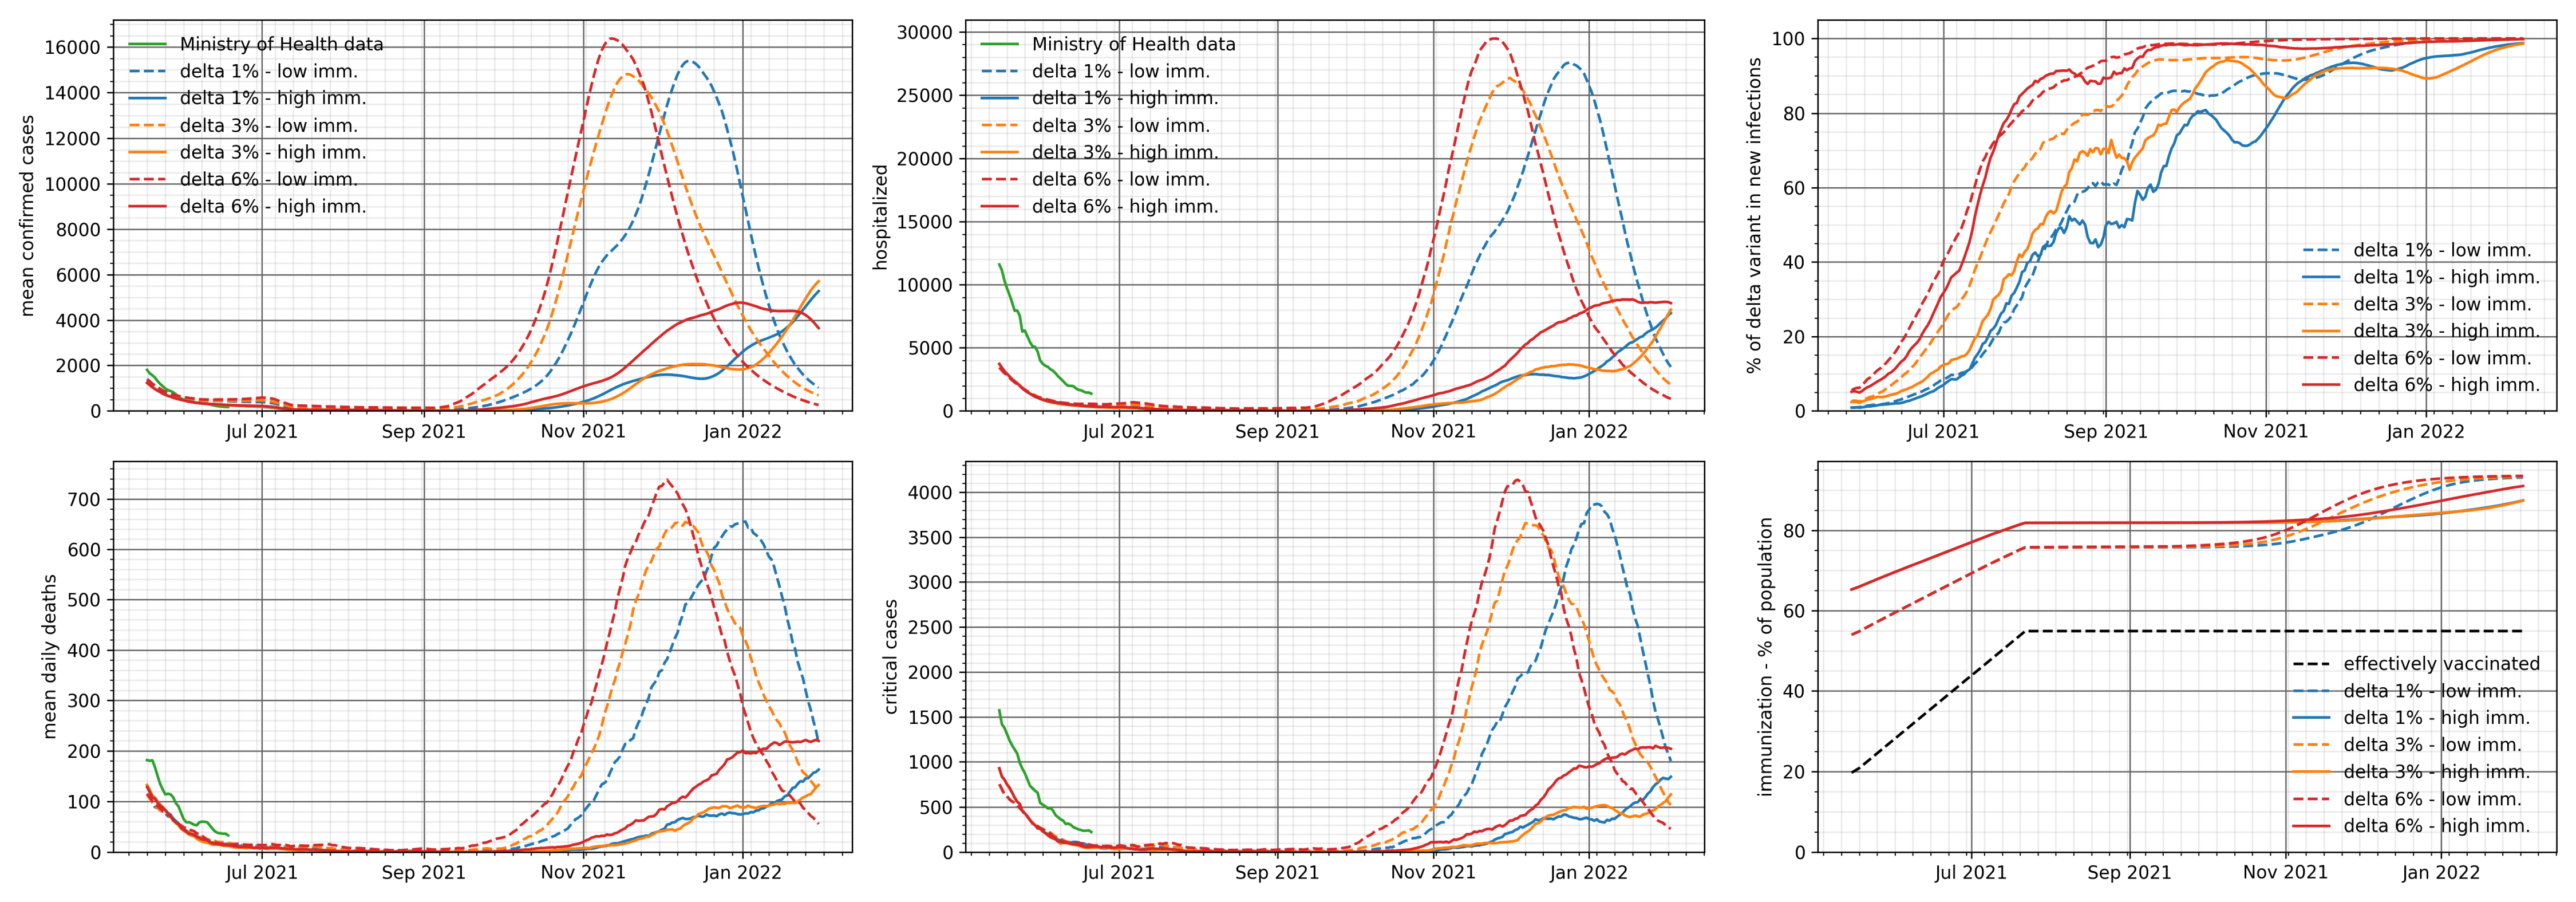
Download the chart in full resolution.
As can be seen in the presented graphs, at a lower level of immunization of the population, the appearance of the Delta variant causes the fourth wave. The assumed share of the variant affects only the time of wave occurrence, not it’s height.
It should be noted that the occurrence of a higher wave in this scenario is associated with several “pessimistic” assumptions, such as the lack of restrictions, very high relative infectivity of the variant and the vaccination limit in age groups.
We present scenarios for the spreading of the epidemic in two variants of the population resistance level – the percentage of recoveries in the population on April 1 is about 35% or about 45%.
We are analyzing two variants of the vaccination program implementation.
1. The optimistic variant assumes that the only limitation of the vaccination rate is the availability of vaccines. In particular, in the optimistic variant of the vaccination program implementation, we assume that by the end of Q2 2021:
• the number of people vaccinated with the first dose will be around 20.9 million,
• including about 17.1 million vaccinated with the first dose of the mRNA vaccine,
• about 3.8 million vaccinated with the first dose of the vectored vaccine.
2. The pessimistic scenario is that each approved age group will no longer get vaccinated when vaccination coverage reaches 70%
Variants of the implementation of the vaccination program
The scenarios take into account all historically introduced restrictions and easing.
The last of them are:
• May 08 opening hotels at 50%,
• May 15 opening of restaurant gardens and opening of classes 4-12 in hybrid mode,
• May 29 opening of restaurants and cinemas at 50%, gym with limits, opening of all schools.
Percentage of successfully vaccinated people in the population as a function of time for both variants of the vaccination program.
The analysis below examines the possibility of the spreading of wave IV of the epidemic, with different variants of school opening on May 4, 2021, and two alternative virus infectivity values in schools.
Basic information about the analysis.
We analyze two variants of the population immunity level – the cumulative amount of actual infections on March 1 is about 25% or about 33%.
In all scenarios, the vaccination program is considered as follows:
• 700-900 thousand persons monthly vaccinated with the first dose of Comirnata (Pfizer) vaccine in the following order:
• 660 thou. age group 20+
• 2 300 thou. age group 70+
• 1,900 thou. age group 60+
In addition, we include vaccinations with the first dose of AstraZeneca at the level of 830 thou. people per month from February 15 in the 20-65 age group. Assuming a 60% effectiveness of this vaccine, this means 500 thou. monthly “successfully vaccinated” people.
The analysis takes into account:
• 02/27 restrictions in the Warmińsko-Mazurskie voivodeship,
• 03/15 restrictions covering 4 more voivodeships,
• 03/20 extension of restrictions to the whole country, in particular school closure,
• 03/29 closing of kindergartens and most services,
• April 19 opening of kindergartens,
• On April 26, hybrid opening of classes 1-3 in 11 voivodeships.
In the analysis below, we assume full-time school openings, in the following variants:
• Grades 1-3,
• Grades 1-8,
• All schools.
For the purposes of this analysis, we assumed two different levels of infectivity in children and adolescents compared to infectivity in adults: reference and higher. This is an assumption that helps to estimate the possible prediction error due to the degree of infectivity of the British variant among children and adolescents or the hypothetical possibility of the emergence of another, as yet unknown factor that increases infectivity among children and adolescents.
Higher immunization (33% as of March 1):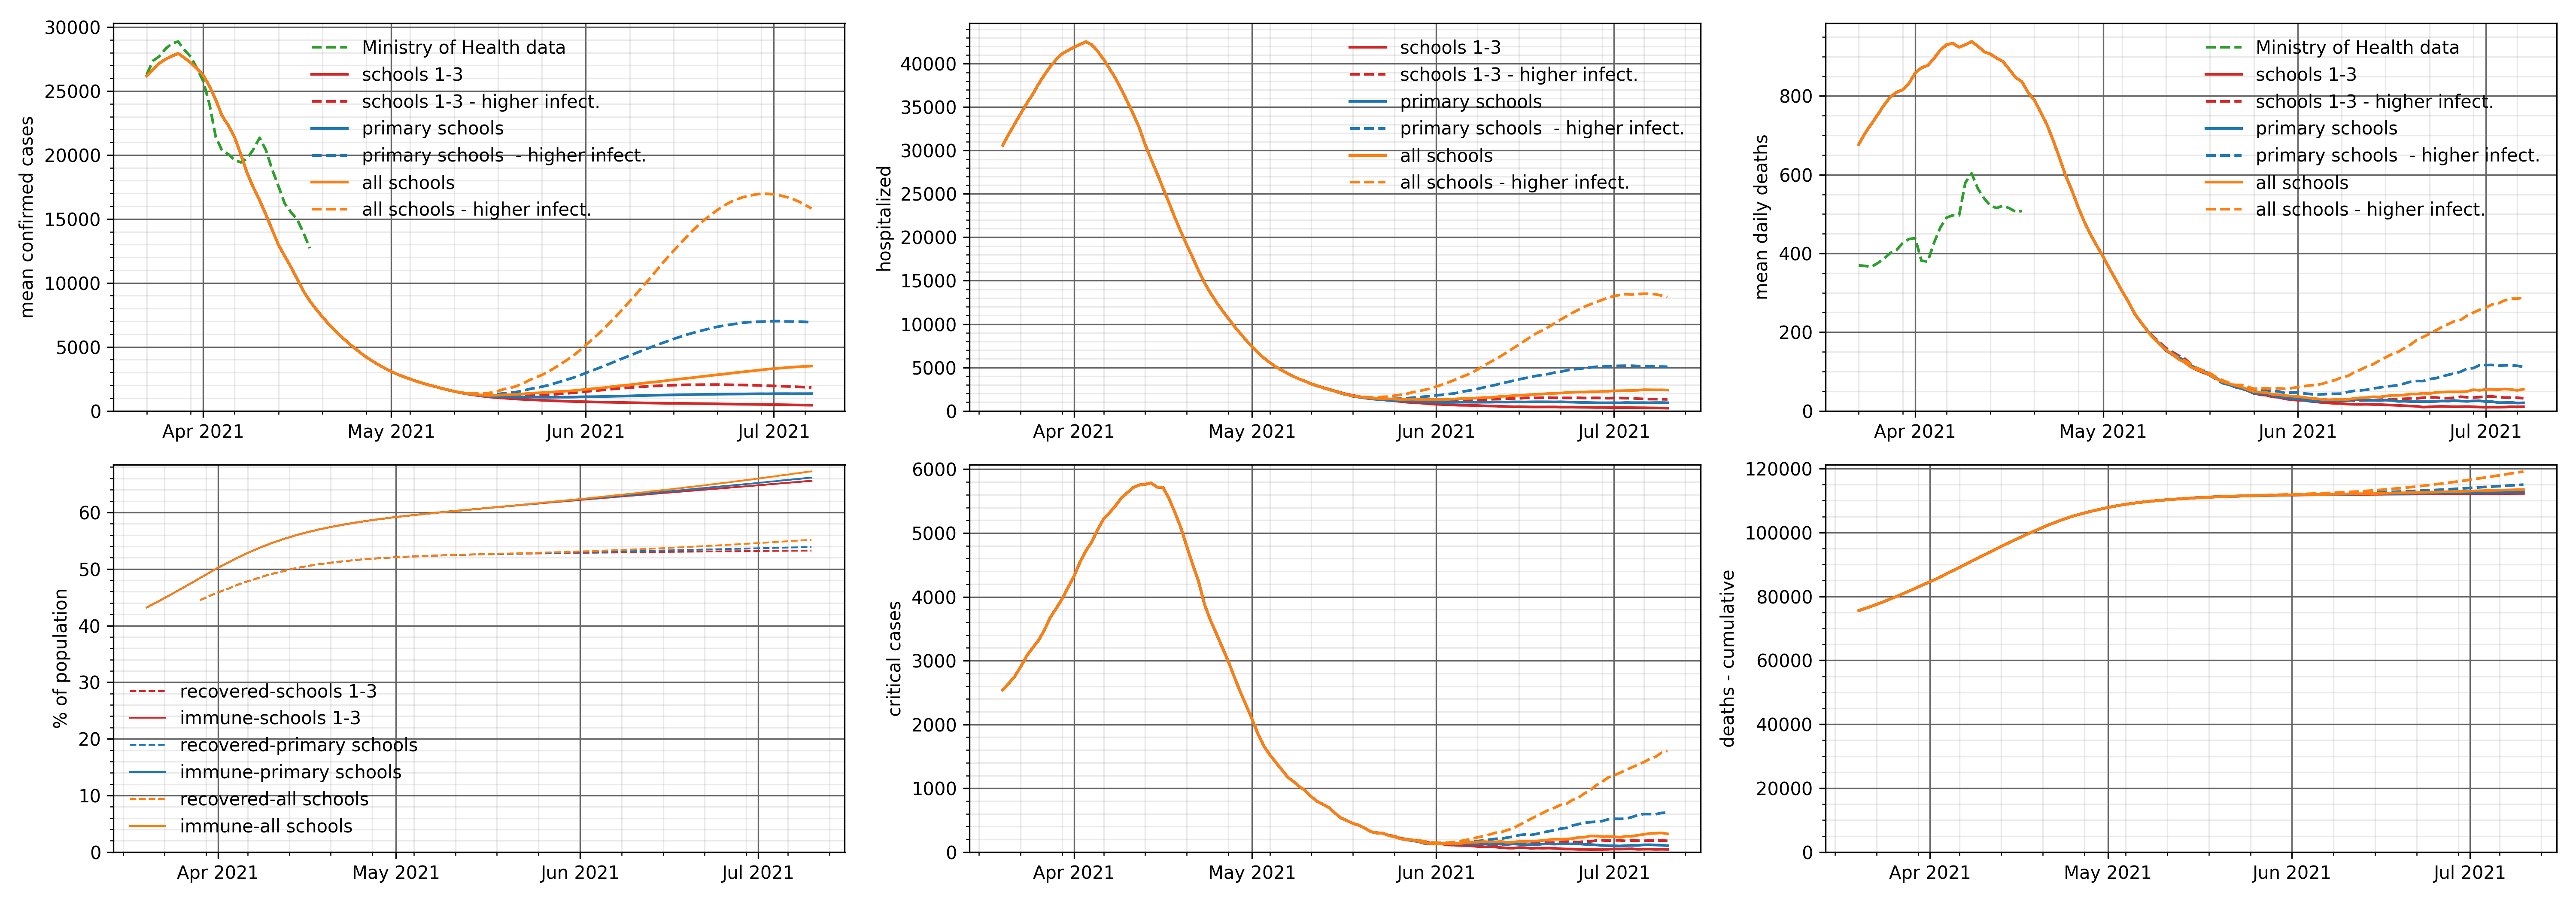
Download the chart in full resolution
Lower immunization (25% as of March 1):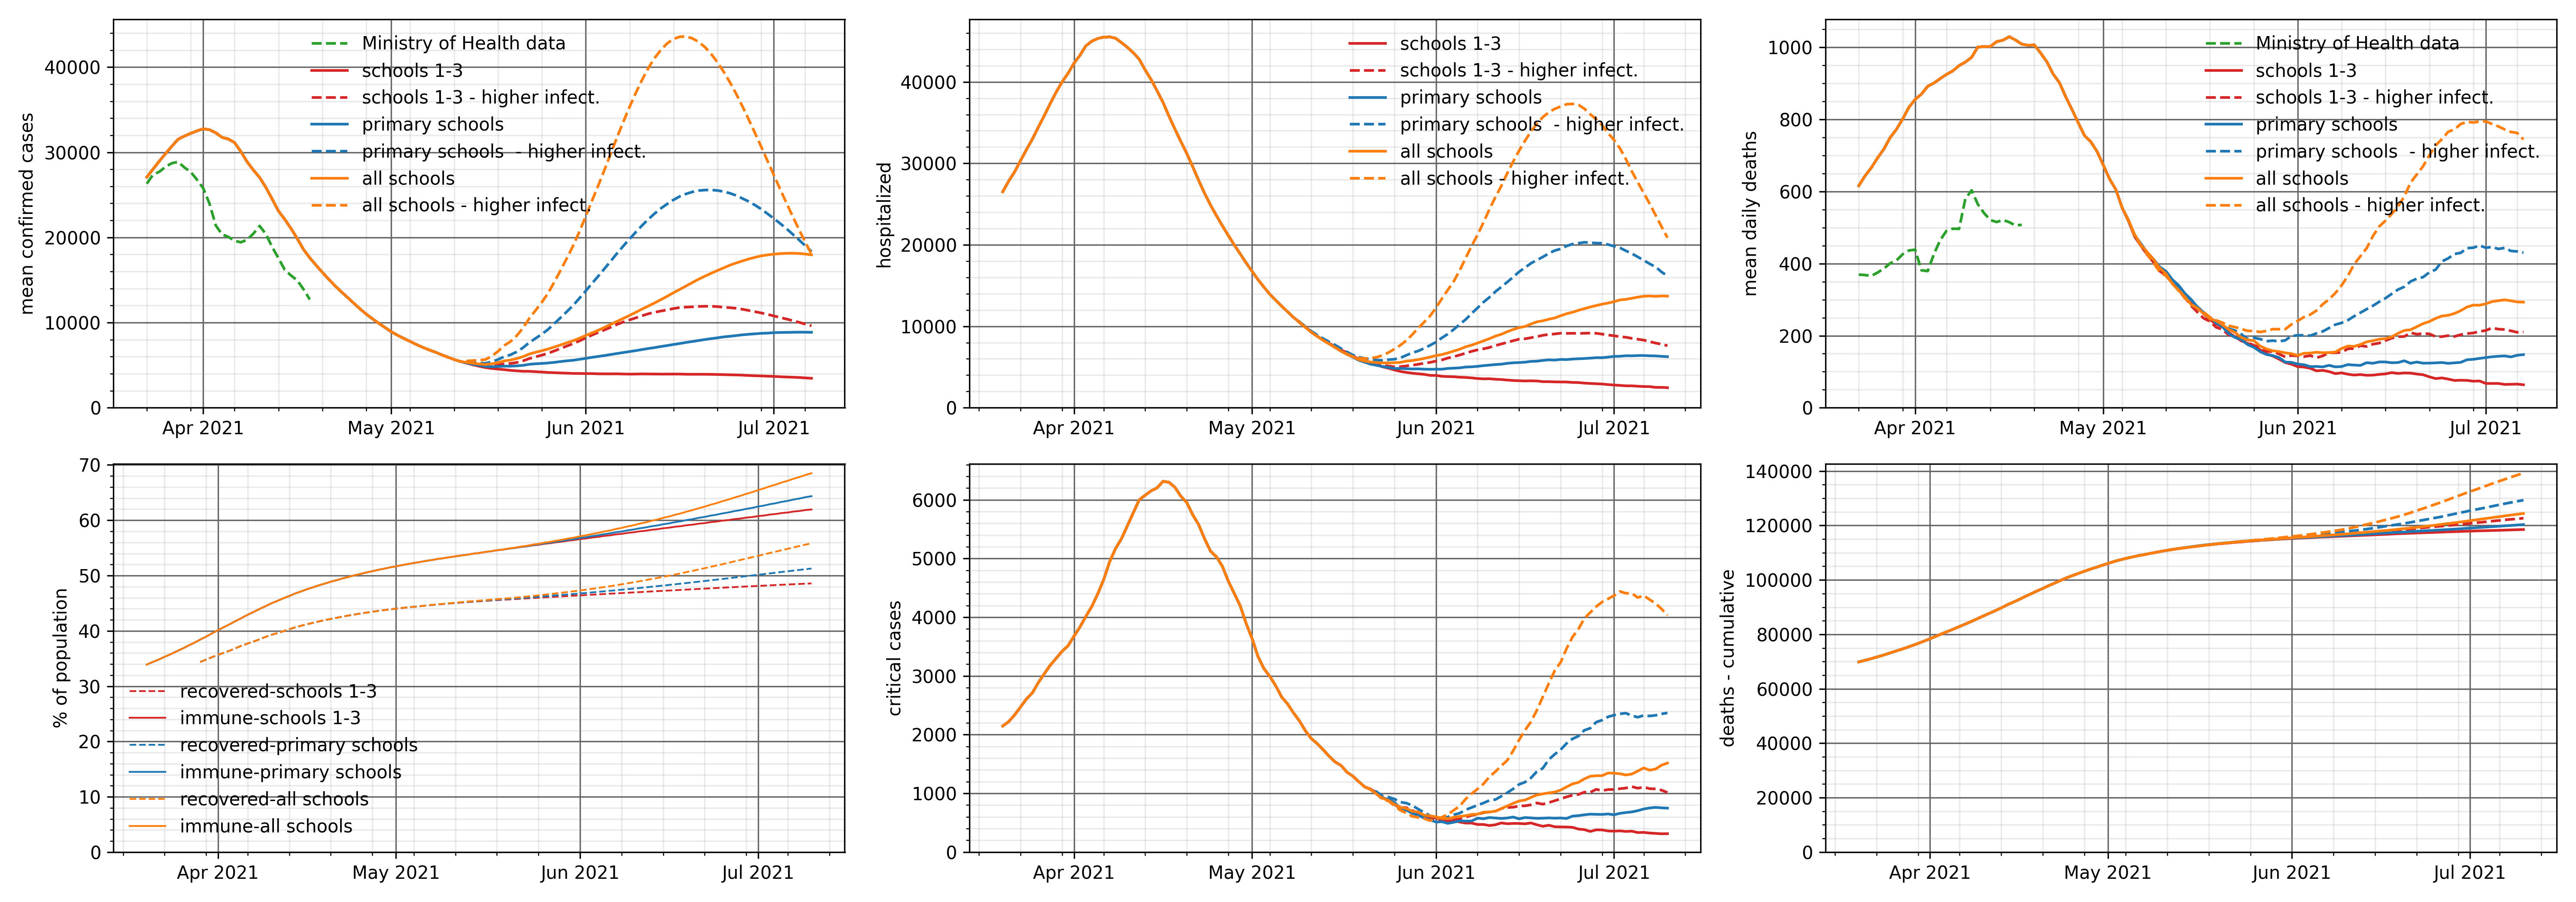
Download the chart in full resolution
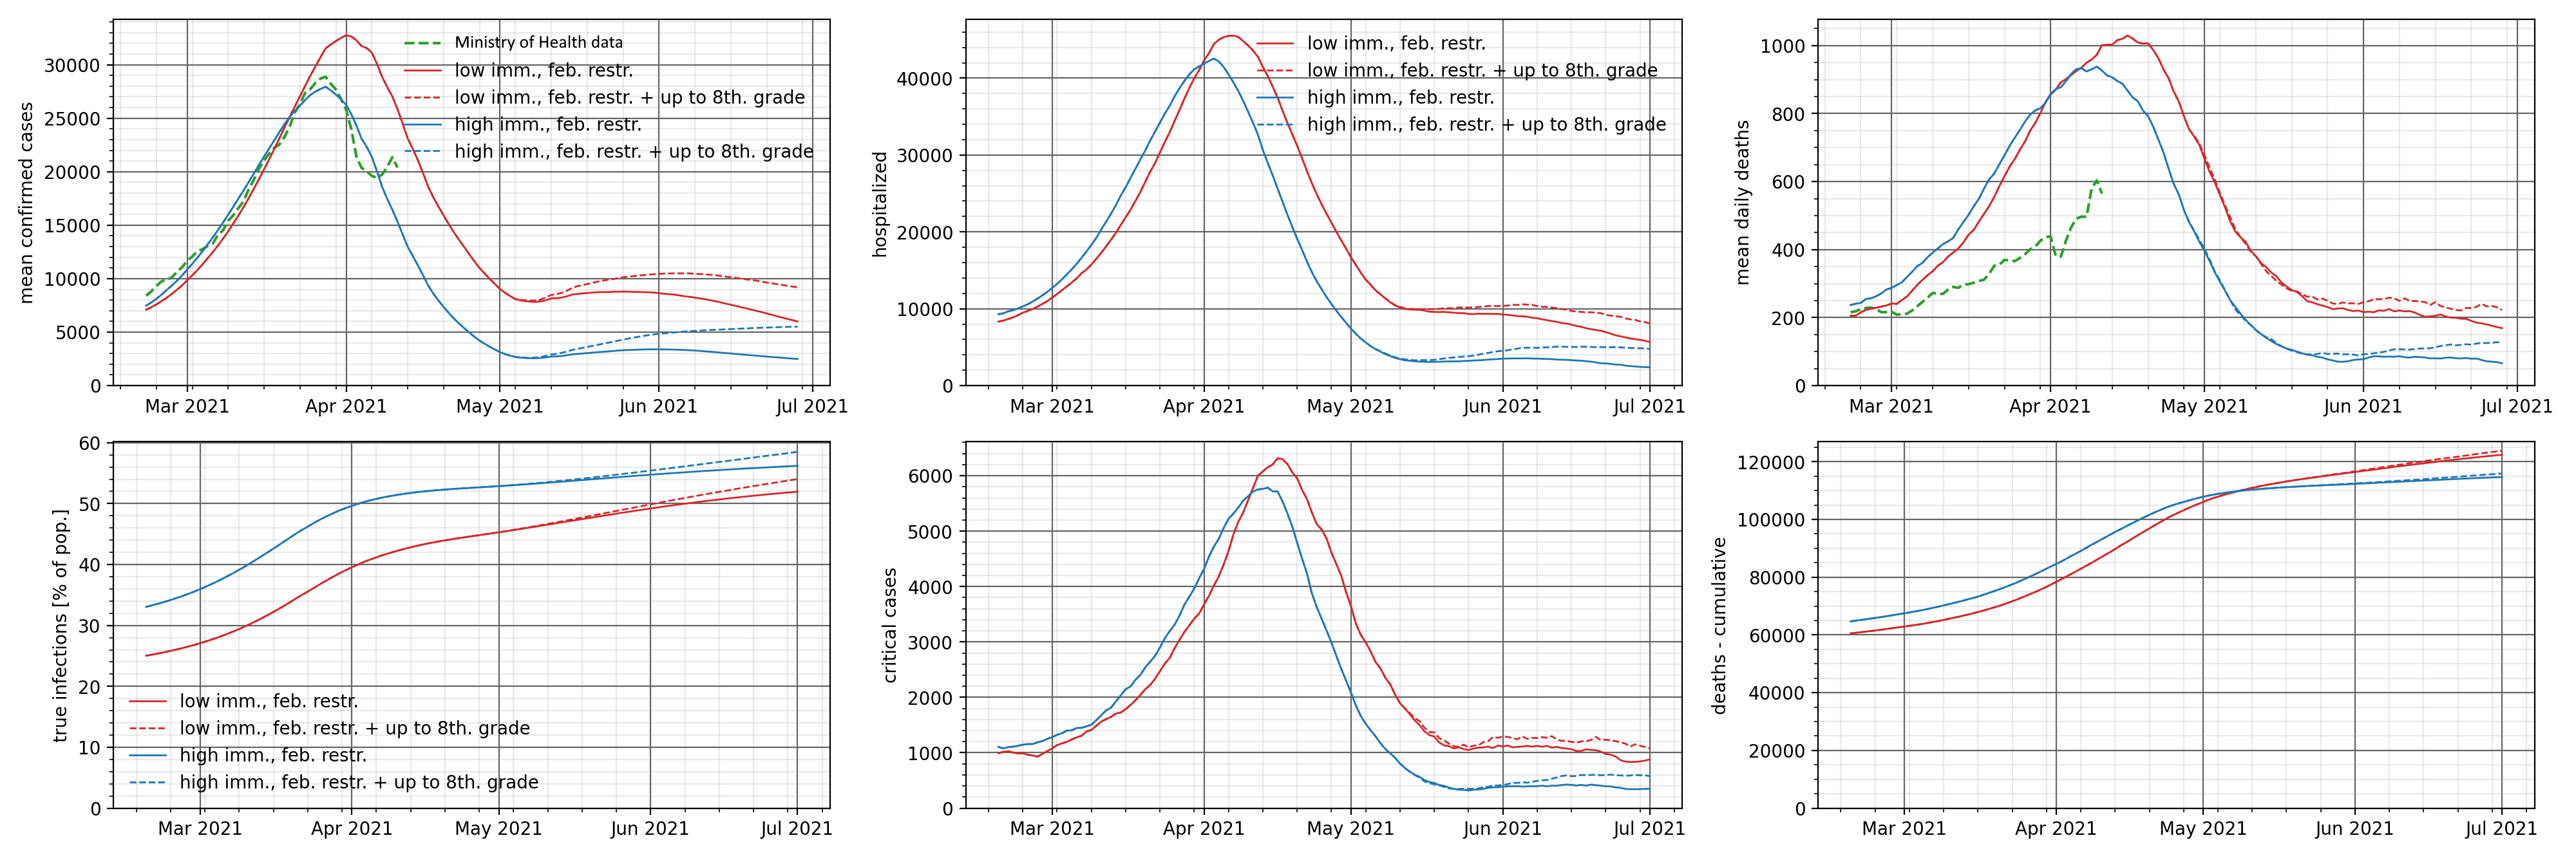
As can be seen from the above charts, in most cases, the potential for wave IV to open schools is negligible or small. The exceptions are situations in which we assume higher infectivity of the virus among children and lower immunization, or we open all facilities in the country at one time.
For a low level of immunization, the potential of wave IV ranges from 18,000 to 44,000 daily cases reported (depending on the range of school openings). In the case of higher immunization, the risk of wave IV occurs only when all schools are opened.
This is consistent with the fact of having higher immunization in grades 1-3 who were not in remote learning and had a greater chance of contracting the infection and, therefore, acquiring immunity.
With the above assumptions, it can be concluded that the opening of classes 1-8 in May does not carry a high risk of the fourth wave of the epidemic, unless a new, so far unknown factor appears, which will cause higher infectivity of the virus among this age group.
We present scenarios for the spreading of the epidemic in two variants of the population immunity level: the cumulative total of actual infections on March 1 is about 25% or about 33%.
In all scenarios, the vaccination program is considered as follows:
• 700-900 thousand persons monthly vaccinated with the first dose of Comirnata (Pfizer) vaccine in the following order:
• 660 thou. age group 20+
• 2 300 thou. age group 70+
• 1,900 thou. age group 60+
In addition, we include vaccinations with the first dose of AstraZeneca at the level of 830 thou. people per month from February 15 in the 20-65 age group. Assuming a 60% effectiveness of this vaccine, this means 500 thou. monthly “successfully vaccinated” people.
The analysis includes all historical restrictions and unfreezing, in particular the latter, i.e .:
• 27.02 – restrictions in the province. Warmia and Mazuria,
• 15.03 – restrictions covering 4 more voivodeships,
• 20.03 – extension of restrictions to the entire country, in particular school closure,
• 29.03 – closing of kindergardens and most services.
Then, we add easing to the baseline forecast restrictions in two variants.
First variant:
• April 19 opening of kindergardens,
• on April 26, return to the situation from February 12, 2021 (without opening hotels),
• May 4 increasing travel (opening of hotels).
Option two:
• as above, plus the opening of classes 1-3 on April 26
We show the collective resistance as a function of time in three graphs:
• successfully vaccinated
• recovered (including those vaccinated)
• all immune
Download the chart in full resolution
As can be seen in the above charts, regardless of the chosen variant of immunizing the public, the potential for the 4th wave after the opening of kindergartens and grades 1-3 is small. The level of immunization in these age groups is higher than in the rest, which is consistent with the analyzes performed so far.
The following scenarios analyze the impact of possible opening of facilities and reduction of administrative restrictions on two levels of public immunization. We understand the immunization of society as the actual, cumulative number of infections in the population.
This is due to the different values of the “dark figure” parameter, which is understood as the ratio of the actual number of all infections to the number of cases found.
In all scenarios, the vaccination program is considered as follows:
• 700-900 thousand persons monthly vaccinated with the first dose of Comirnata (Pfizer) vaccine in the following order:
• 660 thou. age group 20+
• 2 300 thou. age group 70+
• 1,900 thou. age group 60+
In addition, we include vaccinations with the first dose of AstraZeneca at the level of 830 thou. people per month from February 15 in the 20-65 age group. Assuming a 60% effectiveness of this vaccine, this means 500 thou. monthly “successfully vaccinated” people.
The analysis includes all historical restrictions and unfreezing, in particular the latter, i.e .:
• 27.02 – restrictions in the province. Warmia and Mazuria,
• 15.03 – restrictions covering 4 more voivodeships,
• 20.03 – extension of restrictions to the entire country, in particular school closure,
• 29.03 – closing of kindergartens and most services.
The higher variant corresponds to a lower level of immunization (approx. 25% as of March 1, 2021) and the lower variant corresponds to a higher level of immunization (approx. 33% as of March 1, 2021). Recent data indicate that the epidemic is developing along the lower variant.

Download the chart in full resolution
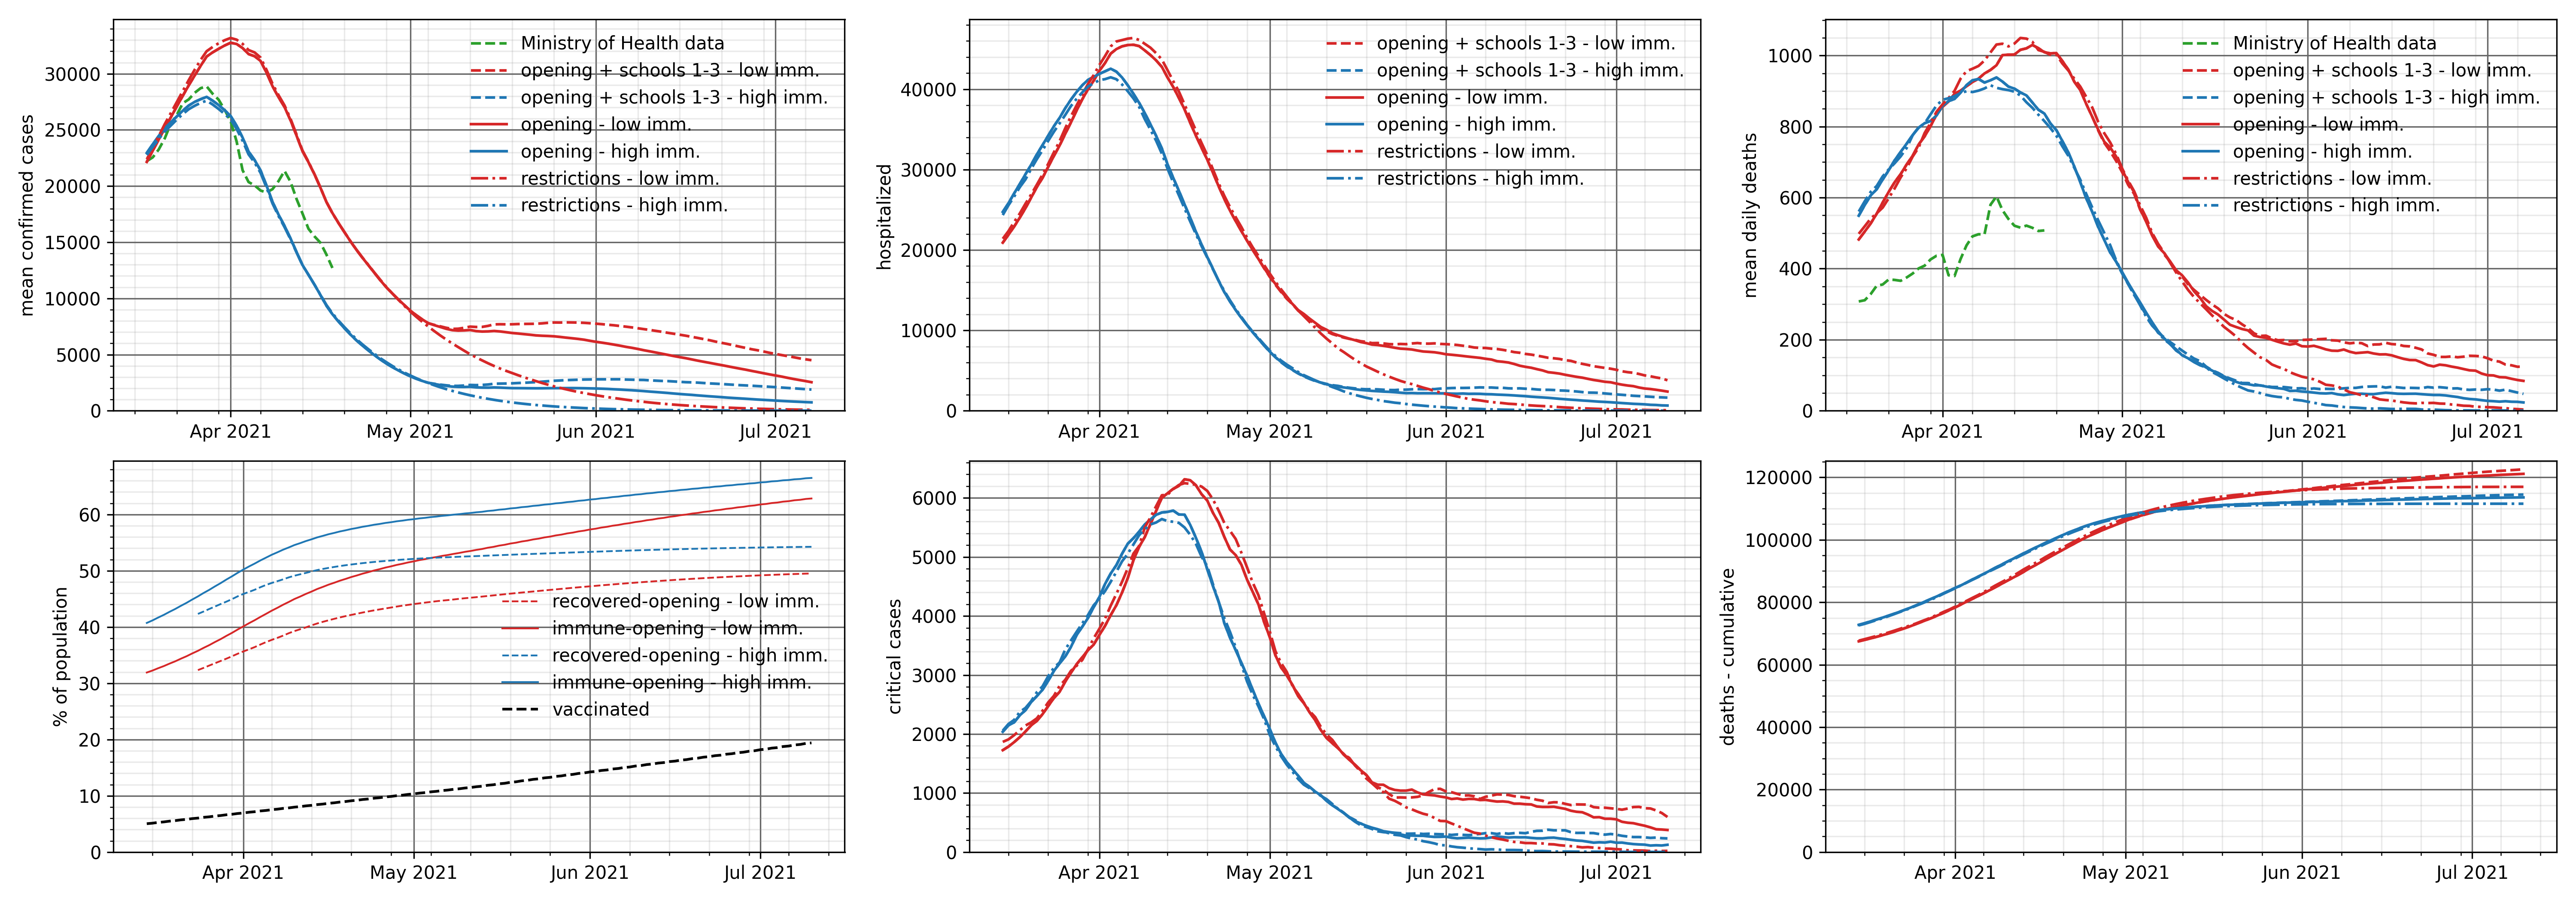
With the above assumptions, we analyze the situation in which some administrative restrictions are removed and some educational institutions are opened.
The graphs below present the number of cases, the cumulative number of actual infections, the number of people requiring hospitalization and ICU patients, and the number of deaths (as daily and cumulative values).
On April 19, kindergartens and classes 1-3 grade are opened, and then:
• April 26 – return to the situation from February 12, 2021 (continuous line),
• April 26 – return to the situation from February 12, 2021 and additional opening of classes 4-8 (dashed line).
Returning to the situation of February 12, 2021 means opening cinemas, theaters, swimming pools, hotels, etc.
All scenarios presented include the opening of classes 1-3 on January 18 and two stages of reduction of restrictions, announced in February 2021:
• February 1: opening of shopping malls and museums,
• February 12: opening of cinemas, theaters, swimming pools, hotels, slopes,
The scenarios take into account the decreasing level of social acceptance for administrative restrictions.
In addition, we show predictions taking into account the existing provincial restrictions and predictions that take into account, in addition to the existing provincial restrictions, also national restrictions planned for March 20. The last included restrictions in a given scenario are introduced for an indefinite period, which is a purely model assumption and in fact, of course, will not take place.
The following scenarios of restrictions are simulated in variants assuming a low and high “dark figure” parameter, which is understood as the ratio of the actual number of all infections to the number of cases.
In all scenarios, the vaccination program is considered as follows:
• 700-900 thousand persons monthly vaccinated with the first dose of Comirnata (Pfizer) vaccine in the following order:
• 660 thou. age group 20+
• 2 300 thou. age group 70+
• 1,900 thou. age group 60+
In addition, we include vaccinations with the first dose of AstraZeneca at the level of 830 thou. people per month from February 15 in the 20-65 age group. Assuming a 60% effectiveness of this vaccine, this means 500 thou. monthly “successfully vaccinated” people.
Epidemic spreading scenarios, cumulative infections and the share of the British version with the assumed low level of immunization:
We present 3 scenarios of restrictions, which assume a low level of immunization (low ratio of the number of all infections to the number of confirmed cases). Each restriction scenario is simulated on two different sets of parameters defining the relative intensity of contacts in particular contexts (v1 more contacts at school compared to the number of contacts in public places; v2 fewer contacts at school).
Assumptions for the British variant:
• Date of seed: 24/12/2020
• Seed amount: 20 thous. people (number of imported cases with British variant)
• Relative infectivity: 2.1 (relative infectivity is a value that describes the biological characteristics of a virus that affects the rate of host cell colonization).
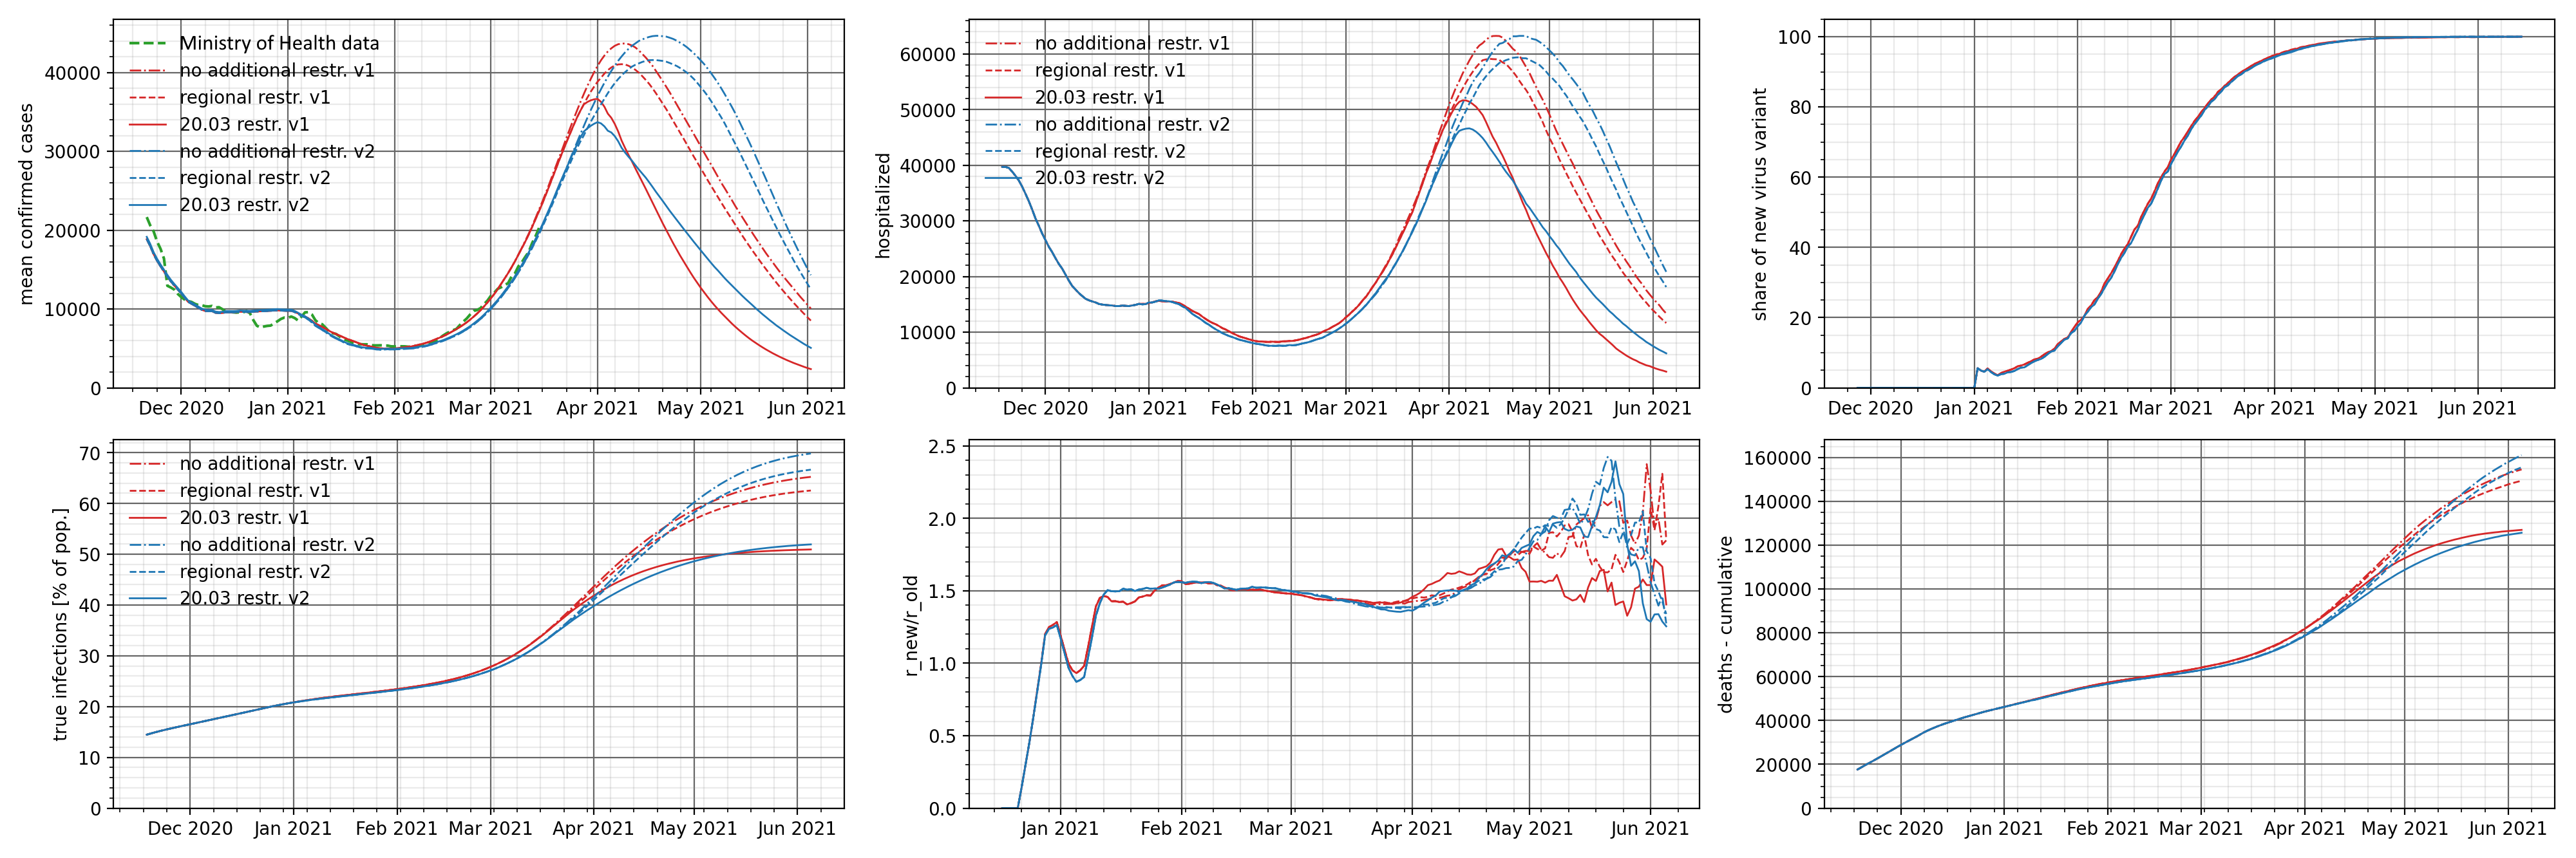
The charts below show the number of identified cases, people requiring hospitalization and the cumulative death rate. Additionally, we present a graph of the R-effective and time share of the British variant and the cumulative actual number of all infections.
As can be expected, stronger restrictions result in a faster decline in the number of daily cases and people requiring hospitalization, and a lower number of deaths. The result of smaller restrictions is a faster increase in the number of people who have been infected. This is a consequence of adopting the assumption that society is more immunized.
Interestingly, the share of the British variant, which is a fraction of the presence in the identified cases, is insensitive to the introduced restrictions. The number of virus variants found will of course vary, but the percentage does not change.
Download the chart in full resolution
Epidemic spreading scenarios, cumulative infections and the share of the British version with the assumed high level of immunization:
We present 3 scenarios of restrictions, which assume a high level of immunization (high ratio of the number of all infections to the number of confirmed cases).
Assumptions for the British variant:
• Date of seed: 24/12/2020
• Seed amount: 30 thous. people (number of imported cases with British variant)
• Relative infectivity: 2.1 (we understand relative infectivity as a value that describes the biological characteristics of a virus that affects the rate of colonization of host cells)
The charts below show the number of identified cases, people requiring hospitalization and the cumulative death rate. Additionally, we present a graph of the R-effective and time share of the British variant and the cumulative actual number of all infections.
Compared to the previous scenario, the number of cases, people requiring hospitalization and deaths are lower. This is due to the adoption of a higher initial immunization of the public. This parameter also affects a faster decrease in the number of cases for different levels of restrictions – compared to the previous forecast, the end of the epidemic takes place in June 2021.
It seems obvious – a higher level of immunization (the actual number of infections) severely limits the spread of the epidemic.
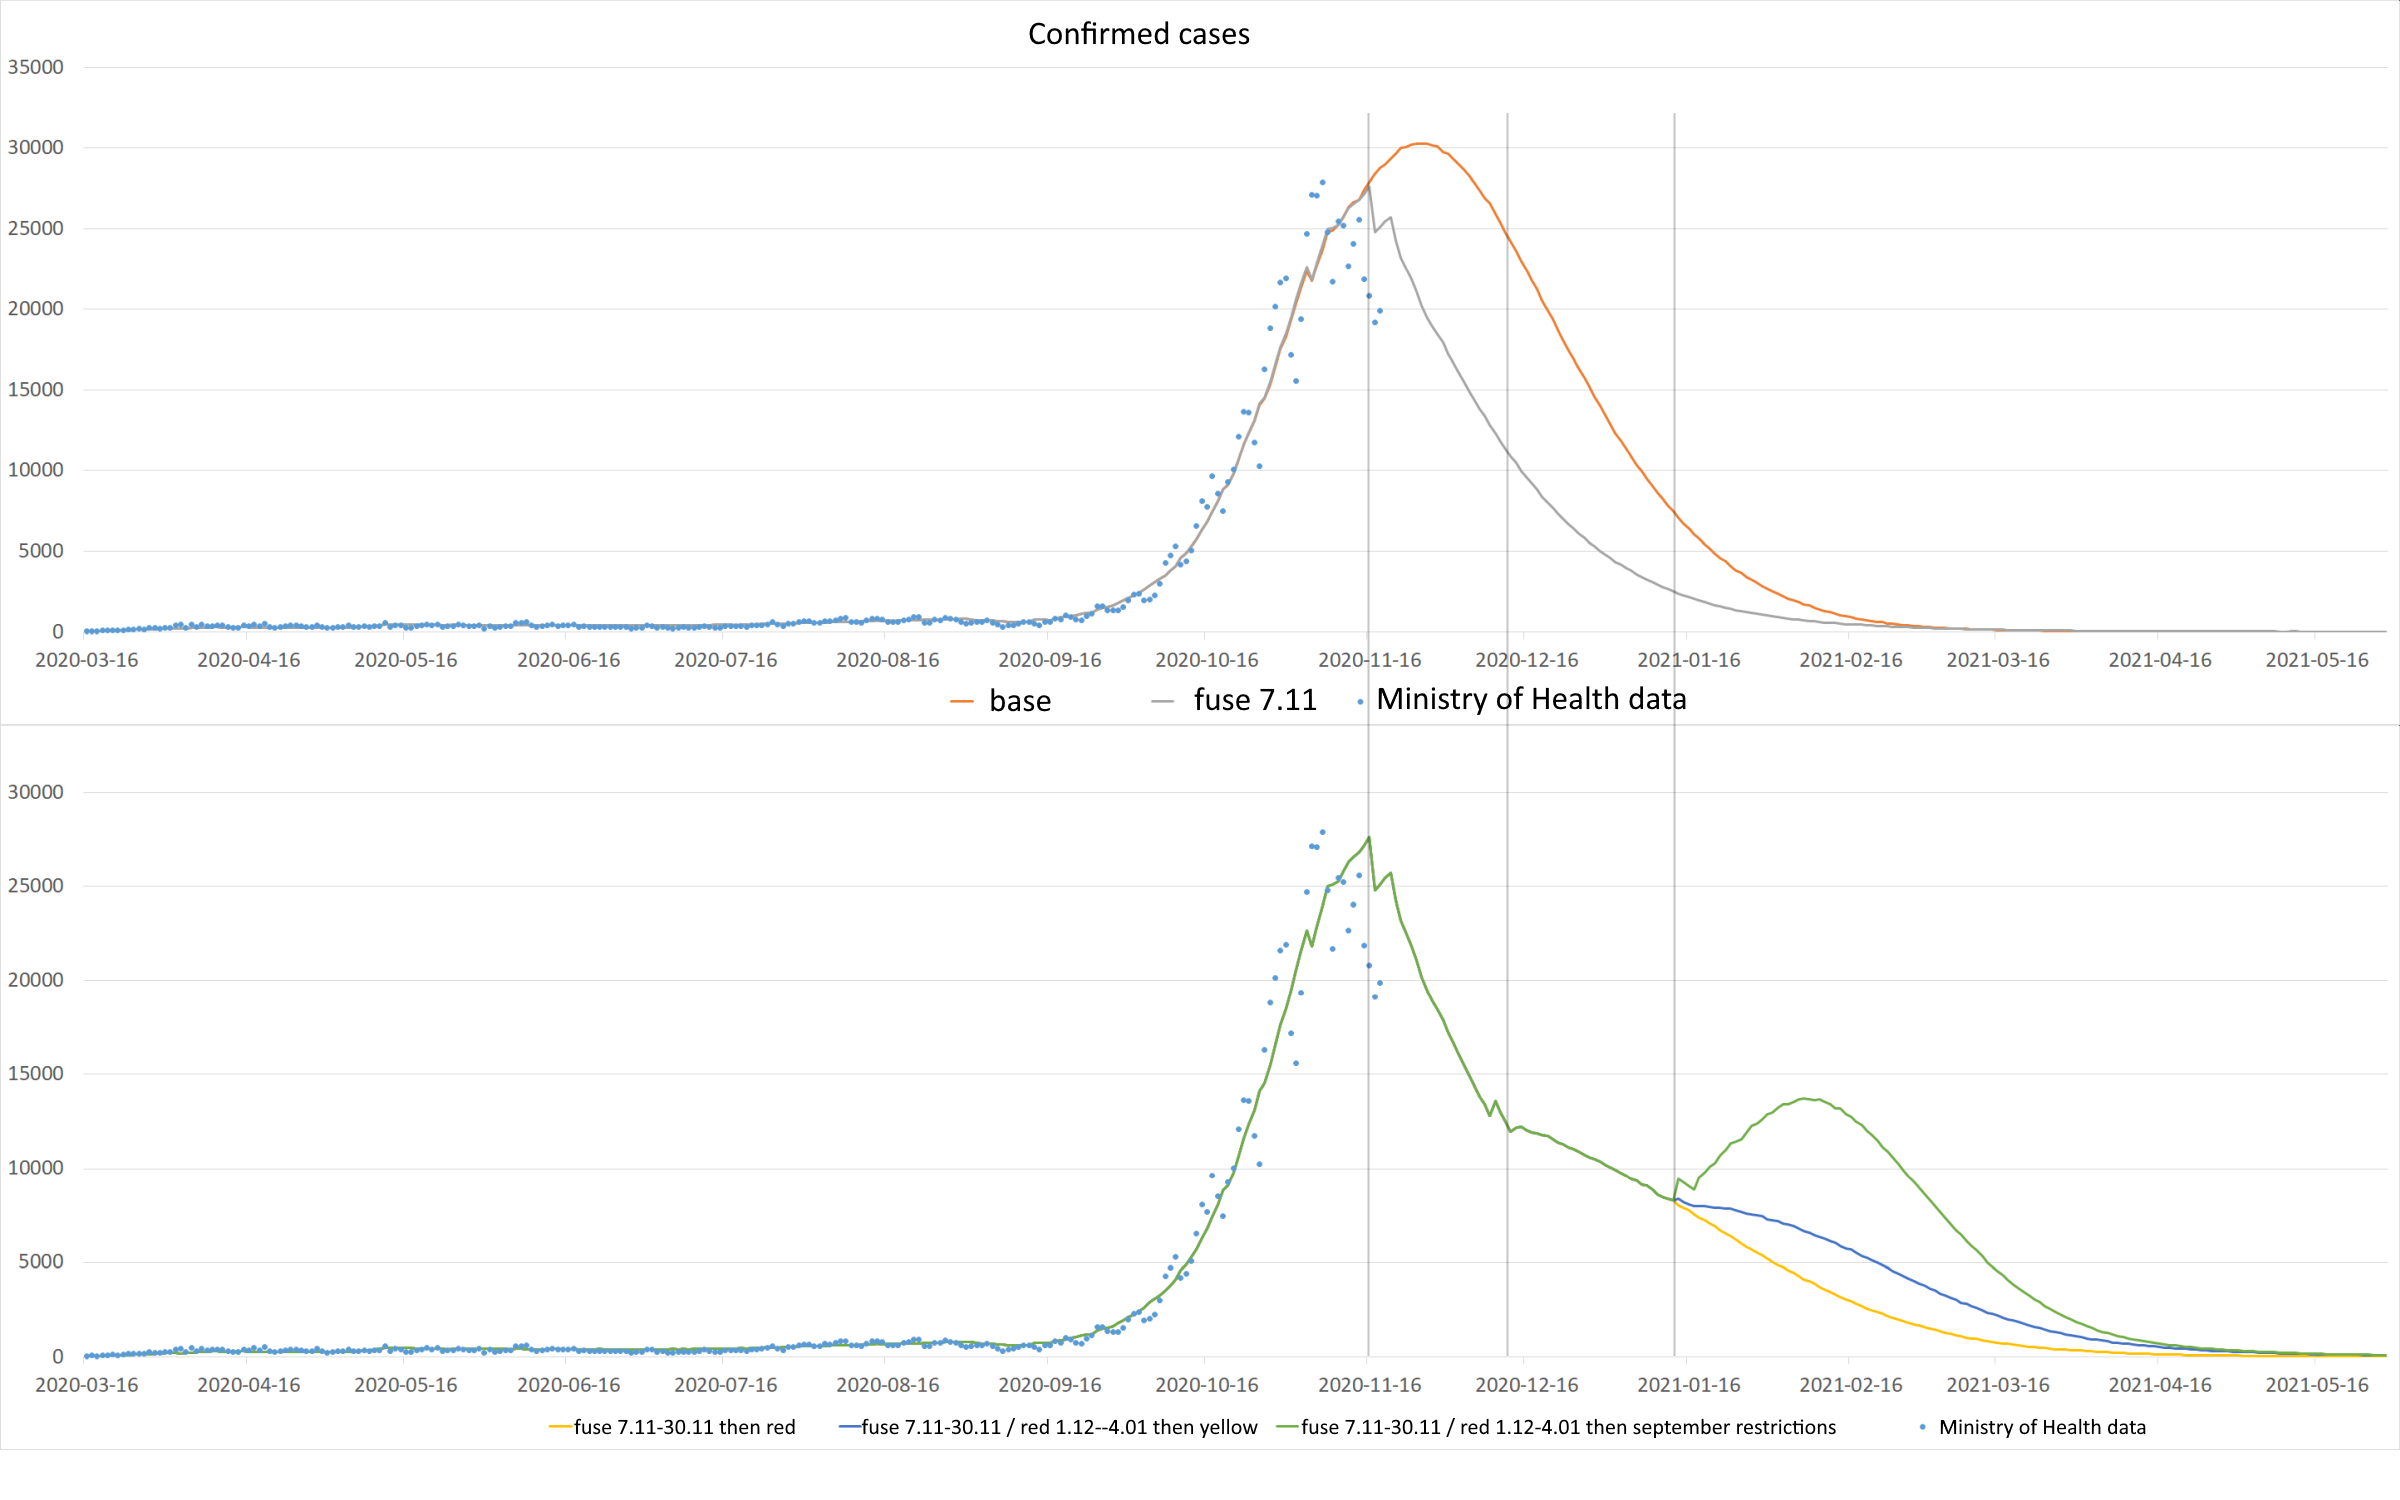
The analysis below concerns variants of the spreading of the epidemic for the forecast from 9/11. The base course includes the introduction of the red zone throughout the country on 10/26.
Observation data is updated to 18/11. The analysis does not take into account the currently considered variants of administrative restrictions (such as winter holidays until 01/17 for the whole country or the opening of shopping malls in the pre-Christmas period).
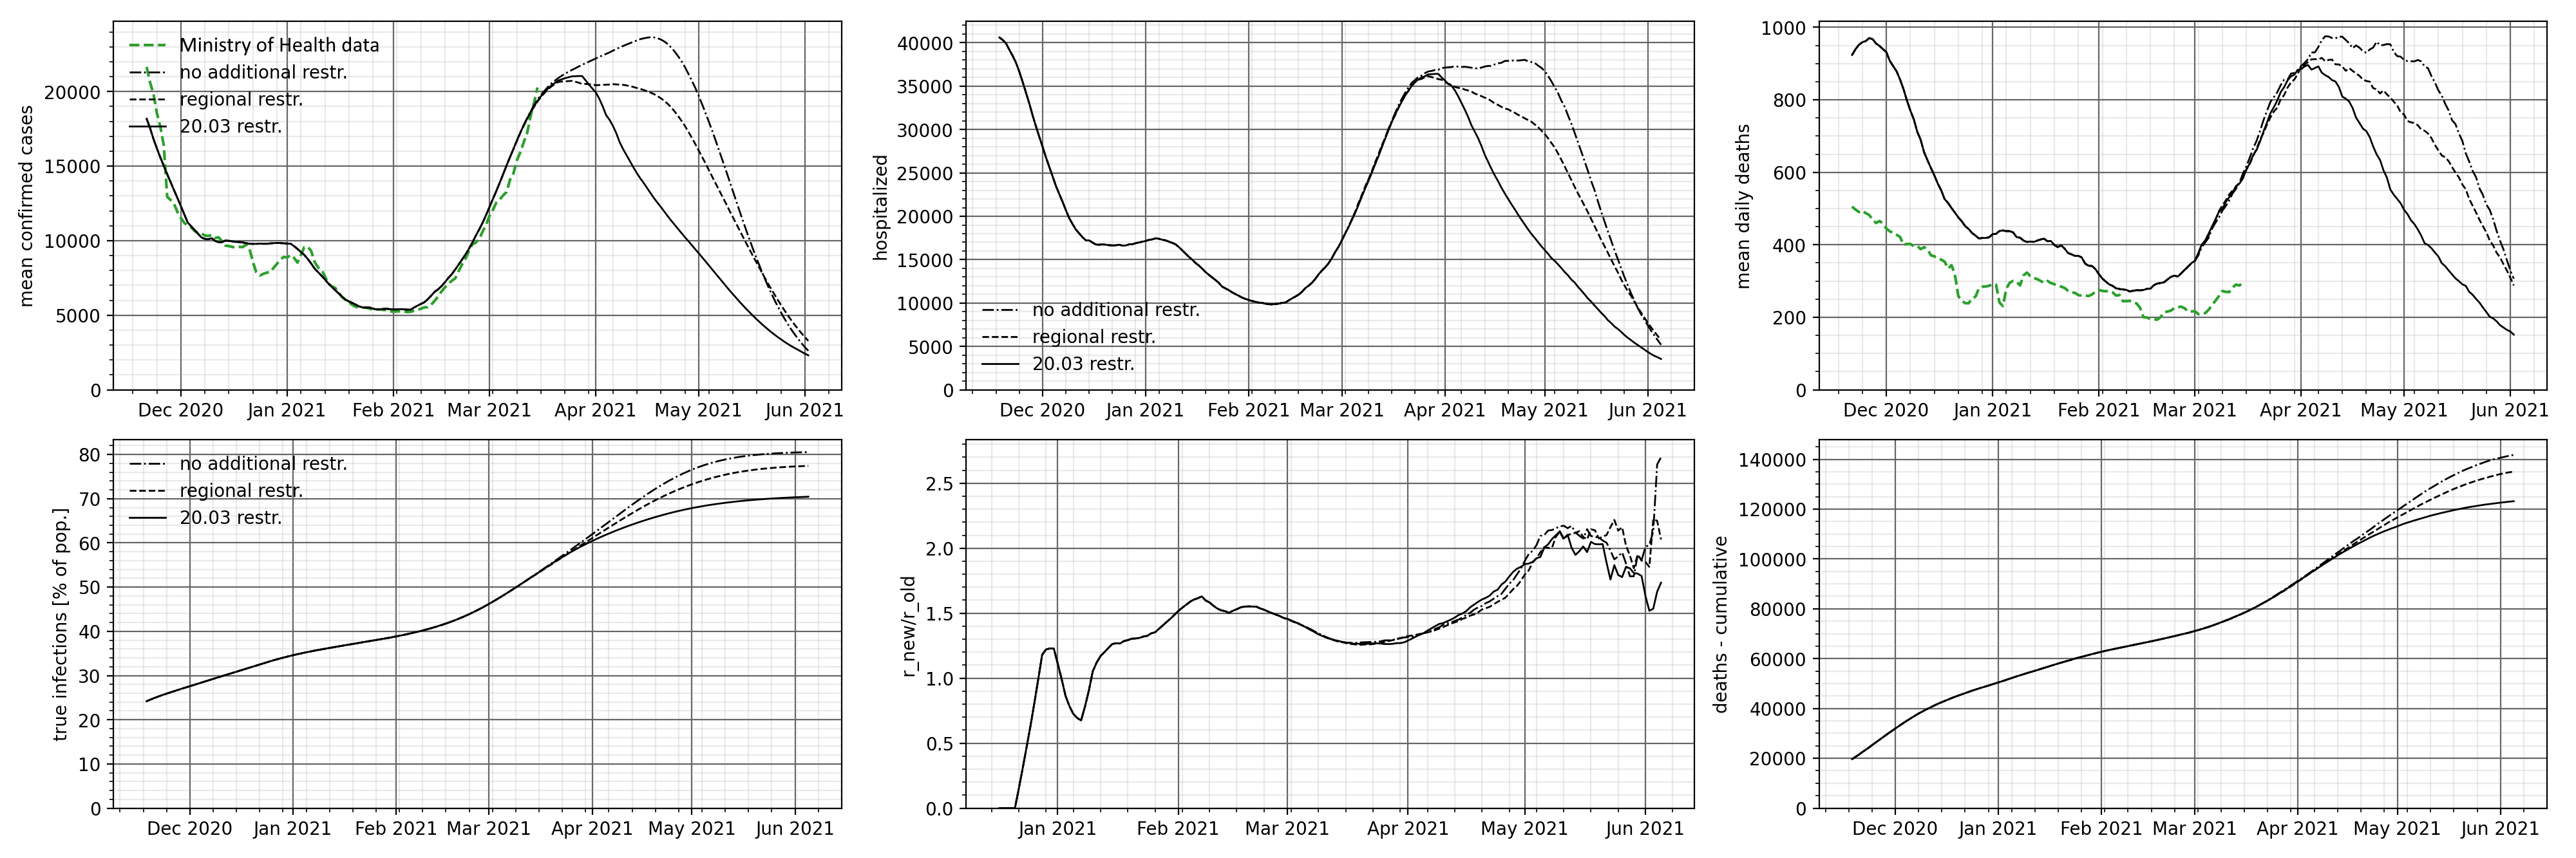
The presented variants relate to the following changes to administrative restrictions:
– Upper Chart: Baseline Waveform
– Upper chart: Basic waveform from the so-called with the fuse inserted 11/07
– Bottom chart: Basic waveform with a fuse and return to the red zone 11/30
– Bottom chart: Basic waveform with a fuse, return to the red zone on 11/30 and then to the yellow zone on 1/04
– Bottom chart: Basic waveform with a fuse, return to the red zone on 11/30 and a return to September restrictions on 1/04
Download the chart in full resolution
In the upper graph, the first waveform change appears on 11/16, when the number of detected cases at the “fuse” begins to decrease, compared to the base waveform. This is a visible effect of introducing restrictions and is consistent with the observed data.
The waveforms of the base waveform and the fuse curve are so “classic” that they do not require additional analysis. In accordance with the adopted modeling assumptions, the number of identified cases will decline rapidly after crossing “the hill” and achieving herd immunity. In this variant, the fuse is not removed, which is a purely model assumption.
On the other hand, in the lower chart, the interesting “curve junction” takes place on 12/09 – 10 days from removing the fuse and returning the whole country to the red zone. Then we observe a slowdown in the decrease in the number of cases found. It seems obvious – the model assumes (and it is in line with what we actually observe) that approximately 10 days after the easing of restrictions, we will record an increase in the number of cases reported.
On January 12 and 13 you can see the greatest divergence of the curves, depending on the selected variant (bottom chart).
Depending on whether the restrictions return to the yellow zone level on January 4 or to the September restrictions (including the opening of schools), we observe differences in the rate of decline in the number of new cases. The most “dramatic” course is the variant back to the September restrictions – the opening of schools causes a sudden increase.
Of course, the above analysis of the courses does not take into account the wide range of possible social behaviors, hygiene habits acquired during the pandemic (which can naturally slow down the spread of the epidemic) or other, not yet implemented solutions, such as hybrid teaching in grades 1-3 or the requirement to wear masks in school and no class changes or isolation of people from groups that are most at risk of contracting the infection and the severe course of the disease.
Below are the waveforms for the number of people currently hospitalized and in the ICU (i.e. active use of a ventilator). As can be seen in the graphs below, the actual numbers of hospitalized and ICU patients run below the modeled curves. This is due to the fact that the model was calibrated to the numbers observed when the health service had an excess of beds and covid respirators.
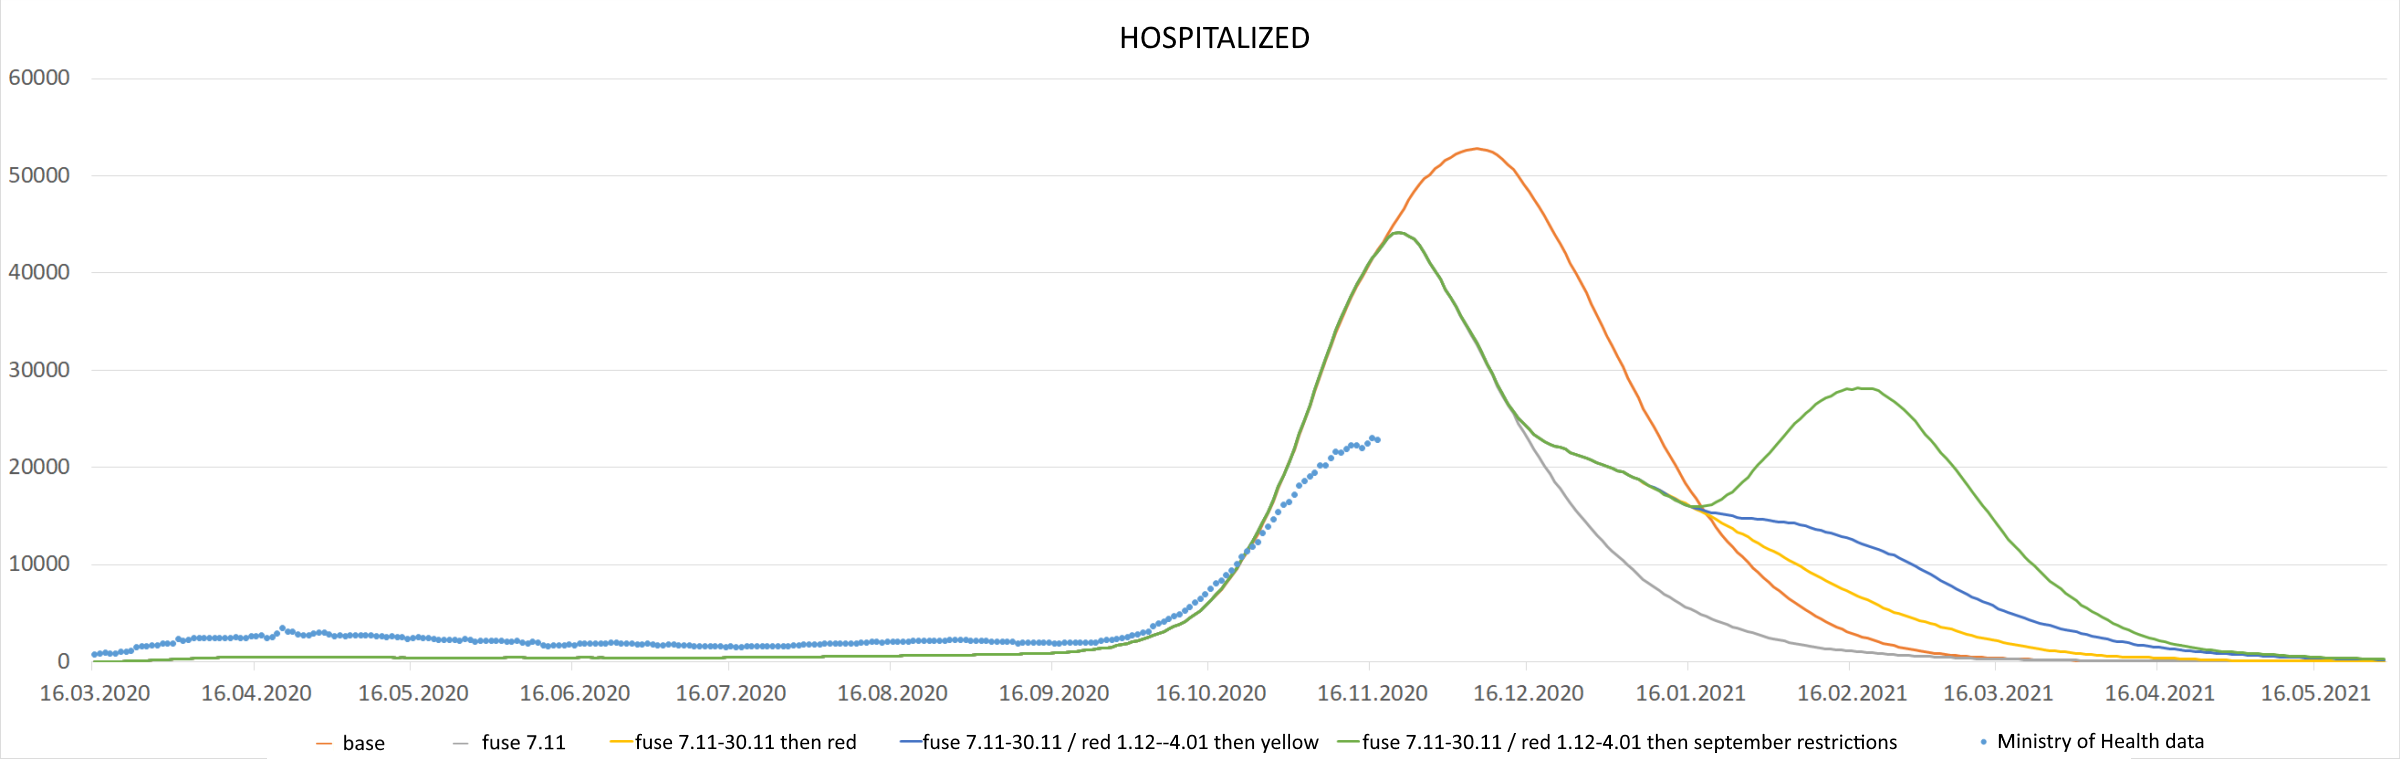
Download the chart in full resolution
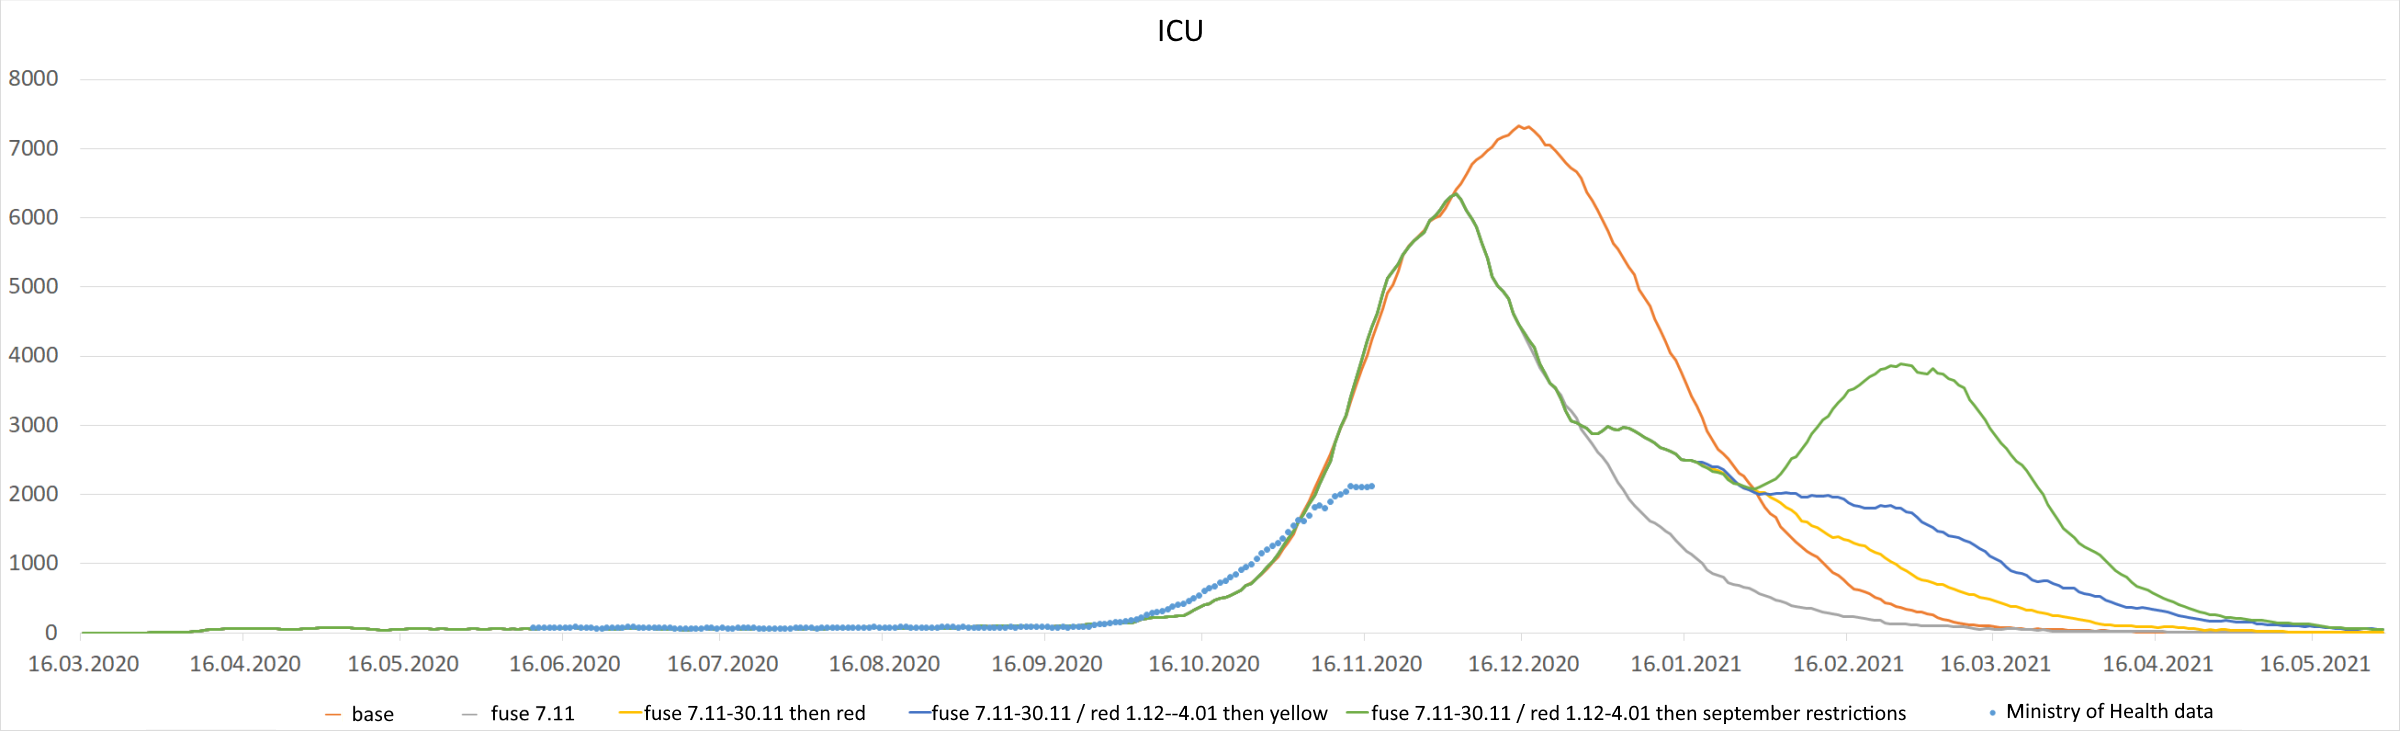
Download the chart in full resolution
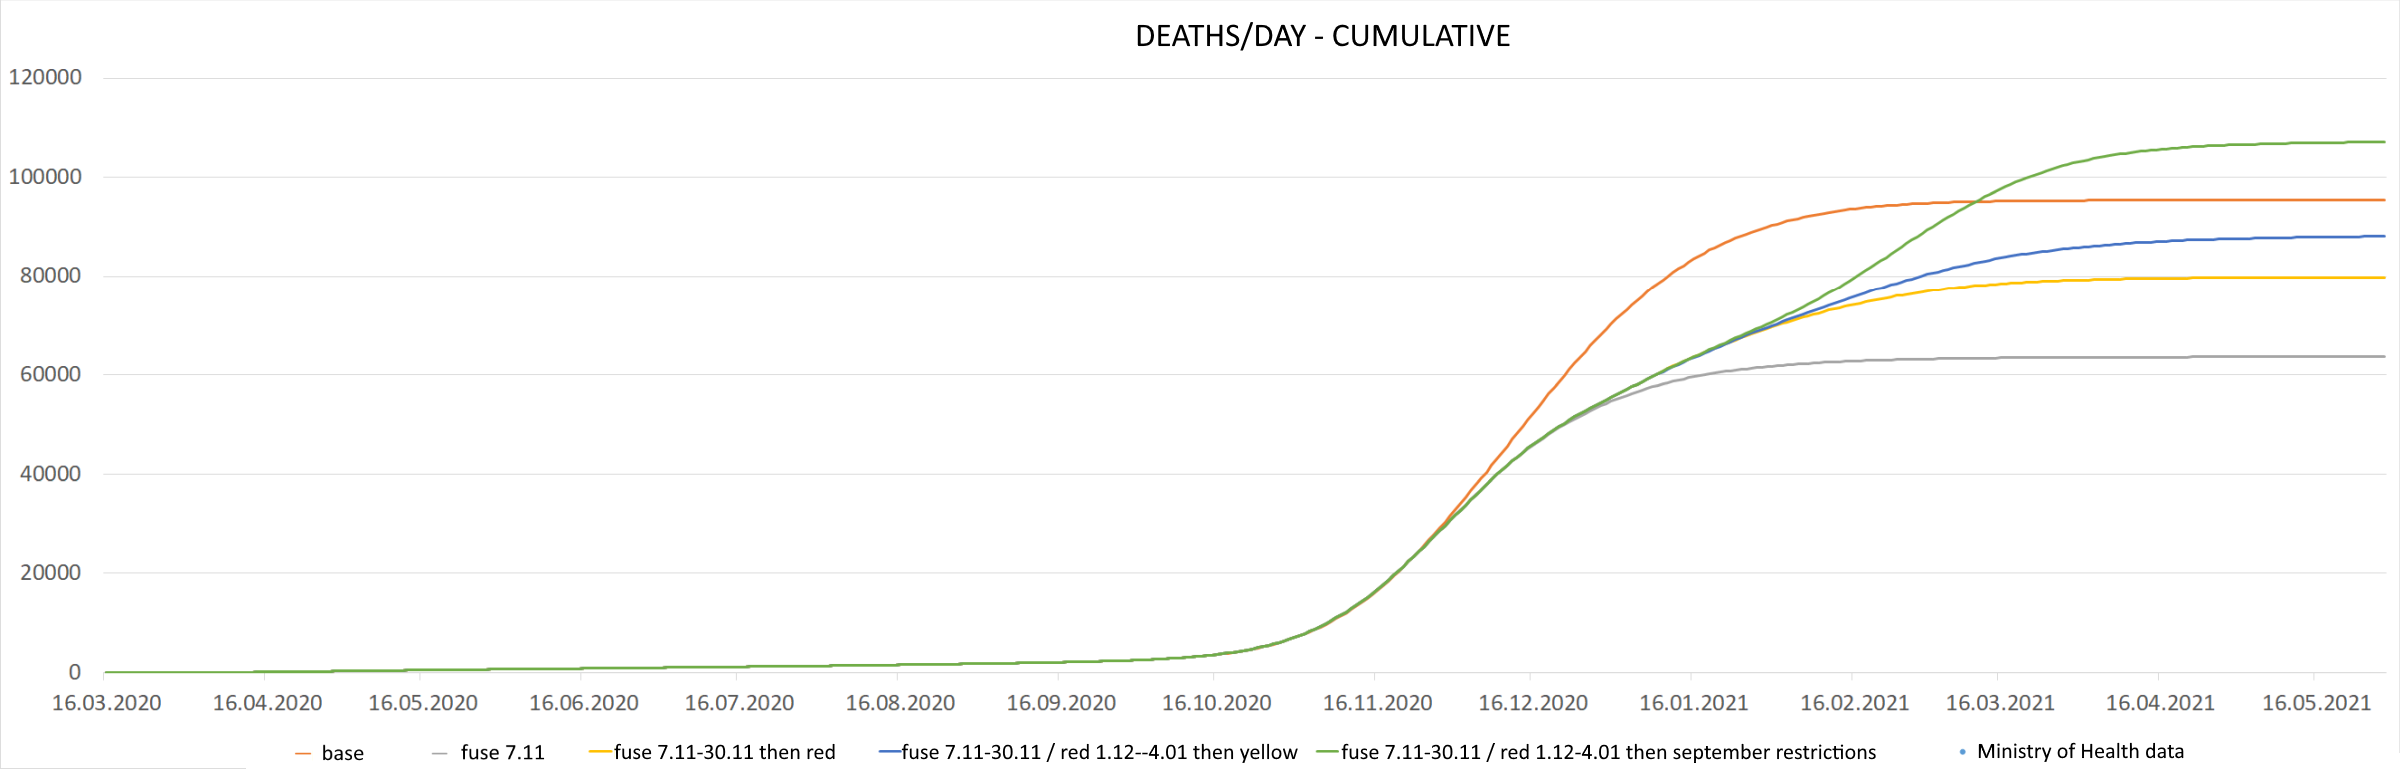
In the analysis of the course of various variants of lifting administrative restrictions, the number of deaths is an important value. For the analyzed waveforms, they are as follows:
– Base Waveform (BW): 95,000
– BW + fuse: 63,000
– BW + fuse + red 11/30: 80,000
– BW + fuse + red 11/30 + yellow 1/04: 88 000
– BW + fuse + red 11/30 + September restrictions 1/04: 107,000
Deaths are straightforward from the model and calibrated to actual data reported in official sources, which may not include all deaths actually caused by Covid-19. Calibration is performed when the forecast is prepared.
The chart below presents a cumulative chart of daily deaths depending on the chosen option of lifting the restrictions.